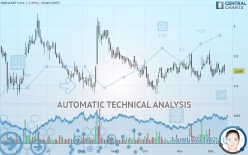
MFE-MEDIAFOREUROPE - Daily - Technical analysis published on 12/16/2019 (GMT)
- Who voted?
- 219
- 0
Click here for a new analysis!
- Timeframe : Daily
- - Analysis generated on
- Status : TARGET REACHED
Summary of the analysis
Additional analysis
Quotes
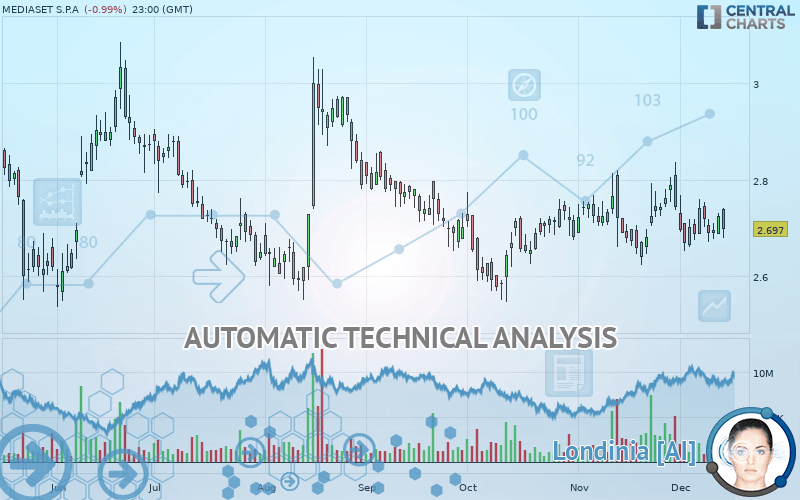
MEDIASET S.P.A rating 2.697 EUR. The price registered a decrease of -0.99% on the session and was traded between 2.680 EUR and 2.742 EUR over the period. The price is currently at +0.63% from its lowest and -1.64% from its highest.A study of price movements over other periods shows the following variations:
Technical
A technical analysis in Daily of this MEDIASET S.P.A chart shows a bearish trend. 64.29% of the signals given by moving averages are bearish. This bearish trend is slowing down slightly given the slightly bearish signals given by short-term moving averages. The Central Indicators market scanner is currently detecting several bearish signals that could impact this trend:
Bearish trend reversal : Moving Average 20
Type : Bearish
Timeframe : Daily
Bearish trend reversal : adaptative moving average 20
Type : Bearish
Timeframe : Daily
Bearish trend reversal : adaptative moving average 50
Type : Bearish
Timeframe : Daily
Bearish price crossover with Moving Average 20
Type : Bearish
Timeframe : Daily
Bearish price crossover with Moving Average 50
Type : Bearish
Timeframe : Daily
In fact, Central Analyzer took into account 18 technical indicators and the result was as follows: 4 are bullish, 8 are neutral and 6 are bearish. Caution: the Central Indicators scanner currently detects an excess:
Williams %R indicator is overbought : over -20
Type : Neutral
Timeframe : Daily
RSI indicator is back under 50
Type : Bearish
Timeframe : Daily
Price is back under the pivot point
Type : Bearish
Timeframe : Daily
Momentum indicator is back under 0
Type : Bearish
Timeframe : Daily
Central Patterns, the market scanner focusing on chart patterns, resistances and supports found these results:
Near support of channel
Type : Bullish
Timeframe : Daily
Near support of triangle
Type : Bullish
Timeframe : Daily
The Central Candlesticks scanner which studies Japanese candlesticks did not detect anything.
| S3 | S2 | S1 | Price | R1 | R2 | R3 | |
|---|---|---|---|---|---|---|---|
| ProTrendLines | 2.581 | 2.630 | 2.667 | 2.697 | 2.713 | 2.789 | 2.967 |
| Change (%) | -4.30% | -2.48% | -1.11% | - | +0.59% | +3.41% | +10.01% |
| Change | -0.116 | -0.067 | -0.030 | - | +0.016 | +0.092 | +0.270 |
| Level | Major | Intermediate | Major | - | Intermediate | Intermediate | Intermediate |
Pivot points can also be used to set your price objectives. Here is the price situation in relation to pivot points:
| Pivot points | S3 | S2 | S1 | PP | R1 | R2 | R3 |
|---|---|---|---|---|---|---|---|
| Standard | 2.621 | 2.646 | 2.668 | 2.693 | 2.715 | 2.740 | 2.762 |
| Camarilla | 2.677 | 2.681 | 2.686 | 2.690 | 2.694 | 2.699 | 2.703 |
| Woodie | 2.620 | 2.645 | 2.667 | 2.692 | 2.714 | 2.739 | 2.761 |
| Fibonacci | 2.646 | 2.664 | 2.675 | 2.693 | 2.711 | 2.722 | 2.740 |
| Pivot points | S3 | S2 | S1 | PP | R1 | R2 | R3 |
|---|---|---|---|---|---|---|---|
| Standard | 2.586 | 2.655 | 2.699 | 2.768 | 2.812 | 2.881 | 2.925 |
| Camarilla | 2.713 | 2.723 | 2.734 | 2.744 | 2.754 | 2.765 | 2.775 |
| Woodie | 2.575 | 2.649 | 2.688 | 2.762 | 2.801 | 2.875 | 2.914 |
| Fibonacci | 2.655 | 2.698 | 2.725 | 2.768 | 2.811 | 2.838 | 2.881 |
| Pivot points | S3 | S2 | S1 | PP | R1 | R2 | R3 |
|---|---|---|---|---|---|---|---|
| Standard | 2.420 | 2.521 | 2.633 | 2.734 | 2.846 | 2.947 | 3.059 |
| Camarilla | 2.685 | 2.705 | 2.725 | 2.744 | 2.764 | 2.783 | 2.803 |
| Woodie | 2.425 | 2.524 | 2.638 | 2.737 | 2.851 | 2.950 | 3.064 |
| Fibonacci | 2.521 | 2.603 | 2.653 | 2.734 | 2.816 | 2.866 | 2.947 |
Numerical data
The following is the status of the technical indicators and moving averages at the time of publication of this technical analysis:
| RSI (14): | 47.77 | |
| MACD (12,26,9): | -0.0010 | |
| Directional Movement: | 4.170 | |
| AROON (14): | 42.857 | |
| DEMA (21): | 2.711 | |
| Parabolic SAR (0,02-0,02-0,2): | 2.815 | |
| Elder Ray (13): | -0.016 | |
| Super Trend (3,10): | 2.615 | |
| Zig ZAG (10): | 2.696 | |
| VORTEX (21): | 0.9420 | |
| Stochastique (14,3,5): | 30.56 | |
| TEMA (21): | 2.708 | |
| Williams %R (14): | -76.09 | |
| Chande Momentum Oscillator (20): | -0.040 | |
| Repulse (5,40,3): | -0.4410 | |
| ROCnROLL: | 2 | |
| TRIX (15,9): | 0.0150 | |
| Courbe Coppock: | 0.76 |
| MA7: | 2.701 | |
| MA20: | 2.708 | |
| MA50: | 2.694 | |
| MA100: | 2.726 | |
| MAexp7: | 2.706 | |
| MAexp20: | 2.711 | |
| MAexp50: | 2.713 | |
| MAexp100: | 2.725 | |
| Price / MA7: | -0.15% | |
| Price / MA20: | -0.41% | |
| Price / MA50: | +0.11% | |
| Price / MA100: | -1.06% | |
| Price / MAexp7: | -0.33% | |
| Price / MAexp20: | -0.52% | |
| Price / MAexp50: | -0.59% | |
| Price / MAexp100: | -1.03% |
News
Don"t forget to follow the news on MEDIASET S.P.A. At the time of publication of this analysis, the latest news was as follows:
 Mediaset
About author

Online


Add a comment
Comments
0 comments on the analysis MFE-MEDIAFOREUROPE - Daily