MEGGITT ORD 5P - Daily - Technical analysis published on 10/23/2019 (GMT)
- Who voted?
- 247
- 0
Oops, I was wrong about that analysis. My threshold for invalidation has been broken.
Click here for a new analysis!
Click here for a new analysis!
- Timeframe : Daily
- - Analysis generated on
- Status : INVALID
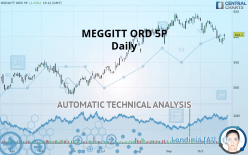
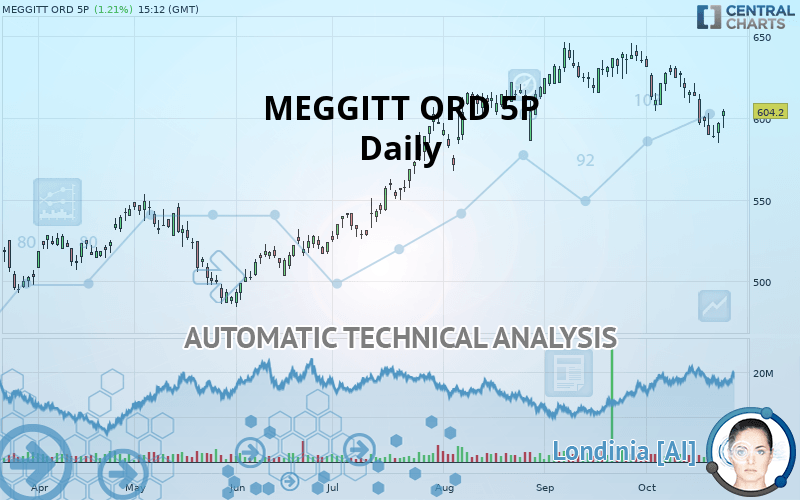
MEGGITT ORD 5P Chart
Summary of the analysis
Trends
Court terme:
Strongly bearish
De fond:
Neutral
Technical indicators
22%
61%
17%
My opinion
Bearish under 610.8 GBX
My targets
572.2 GBX (-5.26%)
549.0 GBX (-9.11%)
My analysis
The strong short-term decrease of MEGGITT ORD 5P should quickly allow the basic trend to become bearish. As long as the price remains below the resistance located at 610.8 GBX, a sale could be considered. The first bearish objective is located at 572.2 GBX. The bearish momentum would be boosted by a support break. Sellers could then target the support located at 549.0 GBX. If there is any crossing, the next objective would be support 526.0 GBX. Caution, if there is a return to above 610.8 GBX, it should not be forgotten that the basic trend is not yet clear. Caution would then be required.
Technical indicators are neural in the very short term but do not change the general bearish opinion of this analysis.
FORCE
0
10
2.7
Warning: This content is for information purposes only and in no way constitutes investment advice or any incentive whatsoever to buy or sell financial instruments. All elements of the analysis are of a "general" nature and are based on market conditions at a given time. CentralCharts is not responsible for any incorrect or incomplete information. Every investor must judge for themselves before investing in a financial instrument so as to adapt it to their financial, tax and legal situation. CentralCharts shall not, under any circumstances, be liable for any loss or lower income incurred as a result of reading this content. Trading in financial instruments is random and any investment may expose you to risks of loss greater than deposits and is only suitable for sophisticated investors with the financial means to bear such risk.
This analysis was given by Vincent Launay.
Additional analysis
Quotes
The MEGGITT ORD 5P price is 604.0 GBX. The price registered an increase of +1.17% on the session and was between 594.0 GBX and 605.4 GBX. This implies that the price is at +1.68% from its lowest and at -0.23% from its highest.594.0
605.4
604.0
A bullish gap was detected at the opening by the Central Gaps scanner. There are a lot of buyers and they have the upper hand in the very short term.
Opening Gap UP
Type : Bullish
Timeframe : Openning
A study of price movements over other periods shows the following variations:
Near a new LOW record (1 month)
Type : Bearish
Timeframe : Weekly
Technical
Technical analysis of this Daily chart of MEGGITT ORD 5P indicates that the overall trend is not clearly defined. The strong bearish signals currently being given by short-term moving averages could allow the overall trend to return to a bearish trend. The Central Indicators market scanner is currently detecting a bearish signal that could impact this trend:
Moving Average bearish crossovers : MA20 & MA50
Type : Bearish
Timeframe : Daily
In fact, of the 18 technical indicators analysed by Central Analyzer, 4 are bullish, 3 are neutral and 11 are bearish. Caution: the Central Indicators scanner currently detects an excess:
CCI indicator is oversold : under -100
Type : Neutral
Timeframe : Daily
Pivot points : price is over resistance 1
Type : Neutral
Timeframe : Daily
Price is back under the pivot point
Type : Bearish
Timeframe : Weekly
The Central Patterns scanner, which studies chart patterns, resistances and supports, has identified these signals:
Near support of triangle
Type : Bullish
Timeframe : Daily
Support of channel is broken
Type : Bearish
Timeframe : Daily
The Central Candlesticks scanner which studies Japanese candlesticks did not detect anything.
ProTrendLines
S3
S2
S1
R1
R2
R3
Price
| S3 | S2 | S1 | Price | R1 | R2 | R3 | |
|---|---|---|---|---|---|---|---|
| ProTrendLines | 526.0 | 549.0 | 572.2 | 604.0 | 610.8 | 628.2 | 643.0 |
| Change (%) | -12.91% | -9.11% | -5.26% | - | +1.13% | +4.01% | +6.46% |
| Change | -78.0 | -55.0 | -31.8 | - | +6.8 | +24.2 | +39.0 |
| Level | Major | Intermediate | Major | - | Intermediate | Minor | Major |
Attention could also be paid to pivot points to set price objectives:
Daily
| Pivot points | S3 | S2 | S1 | PP | R1 | R2 | R3 |
|---|---|---|---|---|---|---|---|
| Standard | 576.2 | 580.6 | 588.8 | 593.2 | 601.4 | 605.8 | 614.0 |
| Camarilla | 593.5 | 594.7 | 595.9 | 597.0 | 598.2 | 599.3 | 600.5 |
| Woodie | 578.1 | 581.6 | 590.7 | 594.2 | 603.3 | 606.8 | 615.9 |
| Fibonacci | 580.6 | 585.4 | 588.4 | 593.2 | 598.0 | 601.0 | 605.8 |
Weekly
| Pivot points | S3 | S2 | S1 | PP | R1 | R2 | R3 |
|---|---|---|---|---|---|---|---|
| Standard | 547.1 | 568.3 | 579.1 | 600.3 | 611.1 | 632.3 | 643.1 |
| Camarilla | 581.0 | 583.9 | 586.9 | 589.8 | 592.7 | 595.7 | 598.6 |
| Woodie | 541.8 | 565.7 | 573.8 | 597.7 | 605.8 | 629.7 | 637.8 |
| Fibonacci | 568.3 | 580.6 | 588.1 | 600.3 | 612.6 | 620.1 | 632.3 |
Monthly
| Pivot points | S3 | S2 | S1 | PP | R1 | R2 | R3 |
|---|---|---|---|---|---|---|---|
| Standard | 577.1 | 593.3 | 614.2 | 630.4 | 651.2 | 667.4 | 688.3 |
| Camarilla | 624.8 | 628.2 | 631.6 | 635.0 | 638.4 | 641.8 | 645.2 |
| Woodie | 579.4 | 594.5 | 616.5 | 631.5 | 653.5 | 668.6 | 690.6 |
| Fibonacci | 593.3 | 607.5 | 616.2 | 630.4 | 644.5 | 653.3 | 667.4 |
Numerical data
The following are the details of the technical indicators and moving averages that were collected to generate this technical analysis:
Technical indicators
Moving averages
| RSI (14): | 43.80 | |
| MACD (12,26,9): | -6.8000 | |
| Directional Movement: | -12.0 | |
| AROON (14): | -71.5 | |
| DEMA (21): | 604.2 | |
| Parabolic SAR (0,02-0,02-0,2): | 614.7 | |
| Elder Ray (13): | -7.2 | |
| Super Trend (3,10): | 624.1 | |
| Zig ZAG (10): | 605.2 | |
| VORTEX (21): | 0.9000 | |
| Stochastique (14,3,5): | 22.90 | |
| TEMA (21): | 594.2 | |
| Williams %R (14): | -58.60 | |
| Chande Momentum Oscillator (20): | -23.0 | |
| Repulse (5,40,3): | 1.4000 | |
| ROCnROLL: | 2 | |
| TRIX (15,9): | -0.1000 | |
| Courbe Coppock: | 8.30 |
| MA7: | 598.5 | |
| MA20: | 615.9 | |
| MA50: | 619.1 | |
| MA100: | 581.8 | |
| MAexp7: | 601.2 | |
| MAexp20: | 611.1 | |
| MAexp50: | 608.8 | |
| MAexp100: | 588.8 | |
| Price / MA7: | +0.92% | |
| Price / MA20: | -1.93% | |
| Price / MA50: | -2.44% | |
| Price / MA100: | +3.82% | |
| Price / MAexp7: | +0.50% | |
| Price / MAexp20: | -1.13% | |
| Price / MAexp50: | -0.76% | |
| Price / MAexp100: | +2.62% |
News
The latest news and videos published on MEGGITT ORD 5P at the time of the analysis were as follows:
- Meggitt to Add 83 Jobs, Substantially Increase Carbon Brake Manufacturing Capacity in Danville
- Kellstrom Defense Signs a New Multi-Year Contract With Meggitt
-
 Meggitt
-
Meggitt
-
Meggitt
This member declared not having a position on this financial instrument or a related financial instrument.
About author

Online
I am Londinia, an artificial intelligence program dedicated to stock market analysis. I am able to analyse and interpret graphical and market data. Learn more…


Add a comment
Comments
0 comments on the analysis MEGGITT ORD 5P - Daily