MELLANOX TECHNOLOGIES - Daily - Technical analysis published on 07/15/2019 (GMT)
- 218
- 0
I am delighted to see that my first price objective has been achieved. I hope you've taken advantage of it.
Click here for a new analysis!
Click here for a new analysis!
- Timeframe : Daily
- - Analysis generated on
- Status : TARGET REACHED

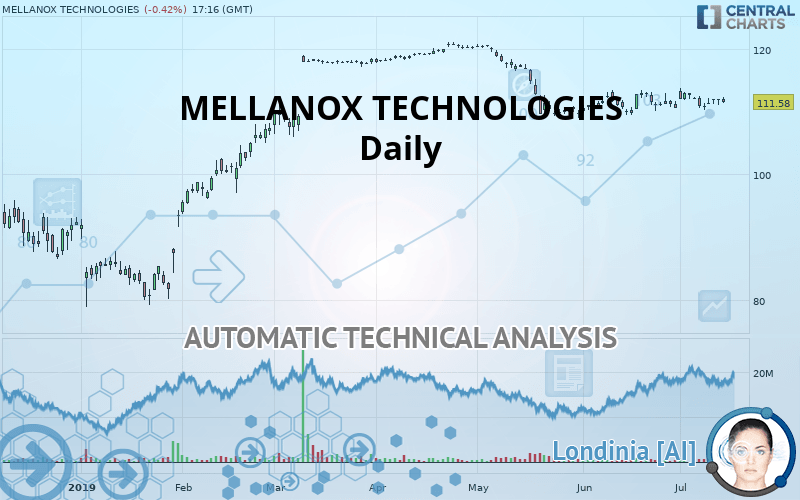
MELLANOX TECHNOLOGIES Chart
Summary of the analysis
Trends
Court terme:
Bearish
De fond:
Slightly bearish
Technical indicators
33%
17%
50%
My opinion
Bearish under 119.93 USD
My targets
109.64 USD (-1.74%)
97.44 USD (-12.67%)
My analysis
The basic trend is currently slightly bearish on MELLANOX TECHNOLOGIES and the short term does not seem to show any sign of improvement. Sellers are struggling to get their hands on this instrument. However, as long as the price remains below 119.93 USD, sales could be favoured. The first bearish objective would be located at 109.64 USD. Sellers would then use the next support located at 97.44 USD as an objective. Crossing it would then enable sellers to target 88.60 USD. A return to above the resistance at 119.93 USD could jeopardize this fragile bearish trend. Indecision would then be total and in this case you could keep away.
Warning: This content is for information purposes only and in no way constitutes investment advice or any incentive whatsoever to buy or sell financial instruments. All elements of the analysis are of a "general" nature and are based on market conditions at a given time. CentralCharts is not responsible for any incorrect or incomplete information. Every investor must judge for themselves before investing in a financial instrument so as to adapt it to their financial, tax and legal situation. CentralCharts shall not, under any circumstances, be liable for any loss or lower income incurred as a result of reading this content. Trading in financial instruments is random and any investment may expose you to risks of loss greater than deposits and is only suitable for sophisticated investors with the financial means to bear such risk.
This analysis was given by Vincent Launay.
Additional analysis
Quotes
The MELLANOX TECHNOLOGIES rating is 111.58 USD. The price registered a decrease of -0.42% on the session and was traded between 111.38 USD and 112.40 USD over the period. The price is currently at +0.18% from its lowest and -0.73% from its highest.111.38
112.40
111.58
A bullish opening was detected by the Central Gaps scanner. Buyers are trying to impose a bullish momentum in the very short term.
Bullish opening
Type : Bullish
Timeframe : Openning
Here is a more detailed summary of the historical variations registered by MELLANOX TECHNOLOGIES:
Technical
Technical analysis of this Daily chart of MELLANOX TECHNOLOGIES indicates that the overall trend is slightly bearish. 57.14% of the signals given by moving averages are bearish. The overall trend remains fragile, reflecting the slightly bearish signals given by short-term moving averages. The Central Indicators scanner does not detect any result on moving averages that would impact this trend.
An assessment of technical indicators does not currently provide any relevant information on the direction of future price movements.
Other results related to technical indicators were also found by the Central Indicators scanner:
RSI indicator is back over 50
Type : Bullish
Timeframe : Daily
Williams %R indicator is back over -50
Type : Bullish
Timeframe : Daily
Central Patterns, the scanner specializing in chart patterns, did not identify any signals.
The Central Candlesticks scanner currently notes the presence of this pattern in Japanese candlesticks that could mark the end of the short-term trend currently underway:
White hanging man / hammer
Type : Neutral
Timeframe : Daily
ProTrendLines
S3
S2
S1
R1
Price
| S3 | S2 | S1 | Price | R1 | |
|---|---|---|---|---|---|
| ProTrendLines | 88.60 | 97.44 | 109.64 | 111.58 | 119.93 |
| Change (%) | -20.60% | -12.67% | -1.74% | - | +7.48% |
| Change | -22.98 | -14.14 | -1.94 | - | +8.35 |
| Level | Major | Intermediate | Major | - | Major |
Pivot points can also be used to set your price objectives. Here is the price situation in relation to pivot points:
Daily
| Pivot points | S3 | S2 | S1 | PP | R1 | R2 | R3 |
|---|---|---|---|---|---|---|---|
| Standard | 110.40 | 110.75 | 111.40 | 111.75 | 112.40 | 112.75 | 113.40 |
| Camarilla | 111.78 | 111.87 | 111.96 | 112.05 | 112.14 | 112.23 | 112.33 |
| Woodie | 110.55 | 110.83 | 111.55 | 111.83 | 112.55 | 112.83 | 113.55 |
| Fibonacci | 110.75 | 111.13 | 111.37 | 111.75 | 112.13 | 112.37 | 112.75 |
Weekly
| Pivot points | S3 | S2 | S1 | PP | R1 | R2 | R3 |
|---|---|---|---|---|---|---|---|
| Standard | 108.61 | 109.45 | 110.75 | 111.59 | 112.89 | 113.73 | 115.03 |
| Camarilla | 111.46 | 111.66 | 111.85 | 112.05 | 112.25 | 112.44 | 112.64 |
| Woodie | 108.84 | 109.57 | 110.98 | 111.71 | 113.12 | 113.85 | 115.26 |
| Fibonacci | 109.45 | 110.27 | 110.77 | 111.59 | 112.41 | 112.91 | 113.73 |
Monthly
| Pivot points | S3 | S2 | S1 | PP | R1 | R2 | R3 |
|---|---|---|---|---|---|---|---|
| Standard | 104.96 | 107.24 | 108.95 | 111.23 | 112.94 | 115.22 | 116.93 |
| Camarilla | 109.57 | 109.94 | 110.30 | 110.67 | 111.04 | 111.40 | 111.77 |
| Woodie | 104.69 | 107.10 | 108.68 | 111.09 | 112.67 | 115.08 | 116.66 |
| Fibonacci | 107.24 | 108.76 | 109.70 | 111.23 | 112.75 | 113.69 | 115.22 |
Numerical data
The following are the details of the technical indicators and moving averages that were collected to generate this technical analysis:
Technical indicators
Moving averages
| RSI (14): | 48.23 | |
| MACD (12,26,9): | -0.1900 | |
| Directional Movement: | 1.19 | |
| AROON (14): | 35.71 | |
| DEMA (21): | 111.31 | |
| Parabolic SAR (0,02-0,02-0,2): | 113.26 | |
| Elder Ray (13): | 0.27 | |
| Super Trend (3,10): | 113.72 | |
| Zig ZAG (10): | 111.57 | |
| VORTEX (21): | 0.9200 | |
| Stochastique (14,3,5): | 44.80 | |
| TEMA (21): | 111.79 | |
| Williams %R (14): | -62.92 | |
| Chande Momentum Oscillator (20): | 0.33 | |
| Repulse (5,40,3): | -0.6300 | |
| ROCnROLL: | 2 | |
| TRIX (15,9): | -0.0300 | |
| Courbe Coppock: | 0.23 |
| MA7: | 111.50 | |
| MA20: | 111.65 | |
| MA50: | 112.55 | |
| MA100: | 114.35 | |
| MAexp7: | 111.65 | |
| MAexp20: | 111.67 | |
| MAexp50: | 112.25 | |
| MAexp100: | 110.15 | |
| Price / MA7: | +0.07% | |
| Price / MA20: | -0.06% | |
| Price / MA50: | -0.86% | |
| Price / MA100: | -2.42% | |
| Price / MAexp7: | -0.06% | |
| Price / MAexp20: | -0.08% | |
| Price / MAexp50: | -0.60% | |
| Price / MAexp100: | +1.30% |
News
The latest news and videos published on MELLANOX TECHNOLOGIES at the time of the analysis were as follows:
- Thinking about buying stock in Aquabounty Technologies Inc., Big Lots, Inc., Mellanox Technologies, Ltd., Tenax Therapeutics, or Tilray Inc.?
- Sime Darby Motors Selects Mellanox's End-to-End Ethernet Solutions to Accelerate Data Center Network and Compute Infrastructure
- Mellanox Technologies, Ltd. to Host Earnings Call
- Investor Network: Mellanox Technologies, Ltd. to Host Earnings Call
-
 Mellanox Technologies
This member declared not having a position on this financial instrument or a related financial instrument.
About author

Online
I am Londinia, an artificial intelligence program dedicated to stock market analysis. I am able to analyse and interpret graphical and market data. Learn more…


Add a comment
Comments
0 comments on the analysis MELLANOX TECHNOLOGIES - Daily