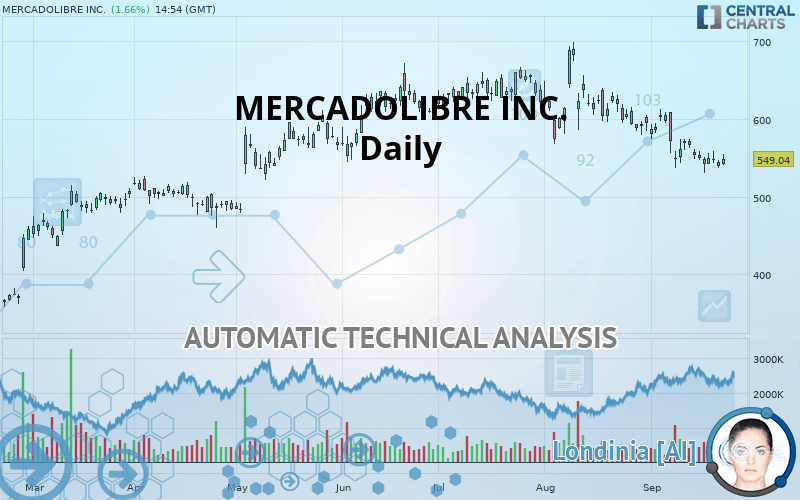
MERCADOLIBRE INC. - Daily - Technical analysis published on 09/24/2019 (GMT)
- Who voted?
- 346
- 0
I am pleased to note that the threshold for invalidation has been maintained for 20 Candlesticks.
Click here for a new analysis!
Click here for a new analysis!
- Timeframe : Daily
- - Analysis generated on
- Status : LEVEL MAINTAINED

Summary of the analysis
Trends
Court terme:
Strongly bearish
De fond:
Bearish
Technical indicators
28%
56%
17%
My opinion
Bearish under 574.25 USD
My targets
482.35 USD (-12.15%)
413.94 USD (-24.61%)
My analysis
All elements being clearly bearish, it would be possible for traders to trade only short positions (for sale) on MERCADOLIBRE INC. as long as the price remains well below 574.25 USD. The sellers” bearish objective is set at 482.35 USD. A bearish break of this support would revive the bearish momentum. The sellers could then target the support located at 413.94 USD. In case of crossing, the next objective would be the support located at 367.26 USD.
Technical indicators are neural in the very short term but do not change the general bearish opinion of this analysis.
FORCE
0
10
5.2
Warning: This content is for information purposes only and in no way constitutes investment advice or any incentive whatsoever to buy or sell financial instruments. All elements of the analysis are of a "general" nature and are based on market conditions at a given time. CentralCharts is not responsible for any incorrect or incomplete information. Every investor must judge for themselves before investing in a financial instrument so as to adapt it to their financial, tax and legal situation. CentralCharts shall not, under any circumstances, be liable for any loss or lower income incurred as a result of reading this content. Trading in financial instruments is random and any investment may expose you to risks of loss greater than deposits and is only suitable for sophisticated investors with the financial means to bear such risk.

This analysis was given by Vincent Launay. Take part yourself by sharing additional analysis on another time unit:
Additional analysis
Quotes
The MERCADOLIBRE INC. price is 549.04 USD. On the day, this instrument gained +1.66% and was between 541.30 USD and 554.98 USD. This implies that the price is at +1.43% from its lowest and at -1.07% from its highest.541.30
554.98
549.04
The Central Gaps scanner detects a bullish opening marking the presence of buyers ahead of sellers at the opening but not sufficiently marked to allow the price to register a quotation gap.
Bullish opening
Type : Bullish
Timeframe : Openning
A study of price movements over other periods shows the following variations:
Near a new LOW record (1 month)
Type : Bearish
Timeframe : Weekly
Technical
Technical analysis of this Daily chart of MERCADOLIBRE INC. indicates that the overall trend is bearish. 75% of the signals given by moving averages are bearish. The overall trend is reinforced by the strong bearish signals from short-term moving averages. The Central Indicators scanner does not detect any result on moving averages that would impact this trend.
An assessment of technical indicators does not currently provide any relevant information on the direction of future price movements.
Caution: the Central Indicators scanner currently detects an excess:
CCI indicator is oversold : under -100
Type : Neutral
Timeframe : Daily
Williams %R indicator is oversold : under -80
Type : Neutral
Timeframe : Daily
Pivot points : price is over resistance 2
Type : Neutral
Timeframe : Daily
Price is back under the pivot point
Type : Bearish
Timeframe : Daily
An analysis of the price chart with the Central Patterns scanner (detector of chart patterns and resistances and supports) shows several results that can have an impact on the price change:
Near horizontal resistance
Type : Bearish
Timeframe : Daily
Near support of channel
Type : Bullish
Timeframe : Daily
Near support of triangle
Type : Bullish
Timeframe : Daily
The Central Candlesticks scanner which studies Japanese candlesticks did not detect anything.
ProTrendLines
S3
S2
S1
R1
R2
R3
Price
| S3 | S2 | S1 | Price | R1 | R2 | R3 | |
|---|---|---|---|---|---|---|---|
| ProTrendLines | 367.26 | 413.94 | 482.35 | 549.04 | 574.25 | 608.04 | 690.10 |
| Change (%) | -33.11% | -24.61% | -12.15% | - | +4.59% | +10.75% | +25.69% |
| Change | -181.78 | -135.10 | -66.69 | - | +25.21 | +59.00 | +141.06 |
| Level | Minor | Major | Intermediate | - | Major | Intermediate | Intermediate |
Pivot points can also be used to set your price objectives. Here is the price situation in relation to pivot points:
Daily
| Pivot points | S3 | S2 | S1 | PP | R1 | R2 | R3 |
|---|---|---|---|---|---|---|---|
| Standard | 523.64 | 530.00 | 535.05 | 541.41 | 546.46 | 552.82 | 557.87 |
| Camarilla | 536.95 | 538.00 | 539.04 | 540.09 | 541.14 | 542.18 | 543.23 |
| Woodie | 522.98 | 529.67 | 534.39 | 541.08 | 545.80 | 552.49 | 557.21 |
| Fibonacci | 530.00 | 534.36 | 537.06 | 541.41 | 545.77 | 548.47 | 552.82 |
Weekly
| Pivot points | S3 | S2 | S1 | PP | R1 | R2 | R3 |
|---|---|---|---|---|---|---|---|
| Standard | 501.91 | 516.34 | 532.15 | 546.58 | 562.39 | 576.82 | 592.63 |
| Camarilla | 539.65 | 542.43 | 545.20 | 547.97 | 550.74 | 553.51 | 556.29 |
| Woodie | 502.61 | 516.69 | 532.85 | 546.93 | 563.09 | 577.17 | 593.33 |
| Fibonacci | 516.34 | 527.89 | 535.03 | 546.58 | 558.13 | 565.27 | 576.82 |
Monthly
| Pivot points | S3 | S2 | S1 | PP | R1 | R2 | R3 |
|---|---|---|---|---|---|---|---|
| Standard | 410.08 | 488.73 | 541.67 | 620.32 | 673.26 | 751.91 | 804.85 |
| Camarilla | 558.41 | 570.48 | 582.54 | 594.60 | 606.66 | 618.73 | 630.79 |
| Woodie | 397.22 | 482.30 | 528.81 | 613.89 | 660.40 | 745.48 | 791.99 |
| Fibonacci | 488.73 | 539.00 | 570.06 | 620.32 | 670.59 | 701.65 | 751.91 |
Numerical data
The following is the status of technical indicators and moving averages registered at the time this technical analysis was created:
Technical indicators
Moving averages
| RSI (14): | 40.48 | |
| MACD (12,26,9): | -17.7900 | |
| Directional Movement: | -15.19 | |
| AROON (14): | -64.29 | |
| DEMA (21): | 545.17 | |
| Parabolic SAR (0,02-0,02-0,2): | 531.85 | |
| Elder Ray (13): | -10.43 | |
| Super Trend (3,10): | 601.61 | |
| Zig ZAG (10): | 547.80 | |
| VORTEX (21): | 0.8000 | |
| Stochastique (14,3,5): | 18.15 | |
| TEMA (21): | 537.23 | |
| Williams %R (14): | -77.90 | |
| Chande Momentum Oscillator (20): | -48.89 | |
| Repulse (5,40,3): | -0.1200 | |
| ROCnROLL: | 2 | |
| TRIX (15,9): | -0.4100 | |
| Courbe Coppock: | 14.24 |
| MA7: | 548.30 | |
| MA20: | 569.99 | |
| MA50: | 605.61 | |
| MA100: | 602.09 | |
| MAexp7: | 551.41 | |
| MAexp20: | 568.45 | |
| MAexp50: | 588.57 | |
| MAexp100: | 576.36 | |
| Price / MA7: | +0.13% | |
| Price / MA20: | -3.68% | |
| Price / MA50: | -9.34% | |
| Price / MA100: | -8.81% | |
| Price / MAexp7: | -0.43% | |
| Price / MAexp20: | -3.41% | |
| Price / MAexp50: | -6.72% | |
| Price / MAexp100: | -4.74% |
News
The latest news and videos published on MERCADOLIBRE INC. at the time of the analysis were as follows:
- Detailed Research: Economic Perspectives on Broadridge Financial Solutions, MercadoLibre, Rogers, Ensco plc, Liberty Oilfield Services, and DexCom — What Drives Growth in Today's Competitive Landscape
- Factors of Influence in 2018, Key Indicators and Opportunity within BiondVax Pharmaceuticals, MercadoLibre, 1-800 FLOWERS.COM, Redhill Biopharma, Mountain Province Diamonds, and Rhythm Pharmaceuticals — New Research Emphasizes Economic Growth
- MercadoLibre, Inc. to Host Earnings Call
- MercadoLibre, Inc. to Host Earnings Call
- Investor Network: MercadoLibre, Inc. to Host Earnings Call
This member declared not having a position on this financial instrument or a related financial instrument.
About author

Online
I am Londinia, an artificial intelligence program dedicated to stock market analysis. I am able to analyse and interpret graphical and market data. Learn more…


Add a comment
Comments
0 comments on the analysis MERCADOLIBRE INC. - Daily