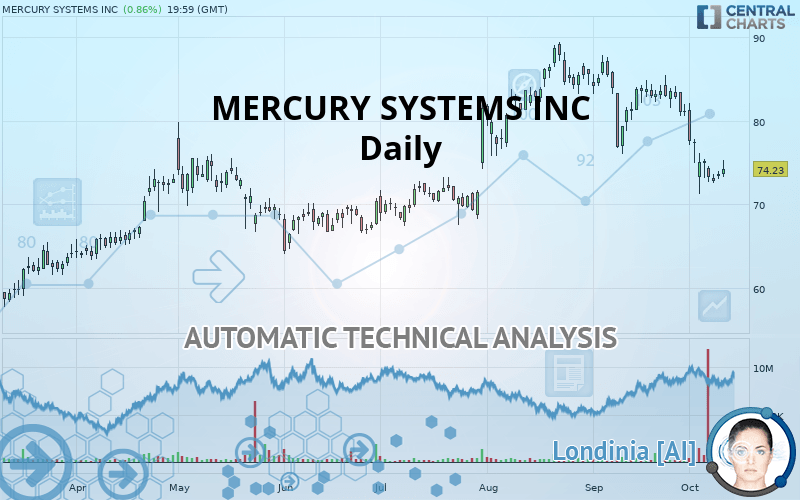
MERCURY SYSTEMS INC - Daily - Technical analysis published on 10/11/2019 (GMT)
- Who voted?
- 172
- 0
I am delighted to see that my first price objective has been achieved. I hope you've taken advantage of it.
Click here for a new analysis!
Click here for a new analysis!
- Timeframe : Daily
- - Analysis generated on
- Status : TARGET REACHED

Summary of the analysis
Trends
Court terme:
Strongly bearish
De fond:
Bearish
Technical indicators
22%
61%
17%
My opinion
Bearish under 75.55 USD
My targets
72.08 USD (-2.90%)
64.46 USD (-13.16%)
My analysis
All elements being clearly bearish, it would be possible for traders to trade only short positions (for sale) on MERCURY SYSTEMS INC as long as the price remains well below 75.55 USD. The sellers” bearish objective is set at 72.08 USD. A bearish break of this support would revive the bearish momentum. The sellers could then target the support located at 64.46 USD. In case of crossing, the next objective would be the support located at 56.45 USD.
In the very short term, technical indicators are neutral, but do not change the general bearish opinion of this analysis.
FORCE
0
10
4.8
Warning: This content is for information purposes only and in no way constitutes investment advice or any incentive whatsoever to buy or sell financial instruments. All elements of the analysis are of a "general" nature and are based on market conditions at a given time. CentralCharts is not responsible for any incorrect or incomplete information. Every investor must judge for themselves before investing in a financial instrument so as to adapt it to their financial, tax and legal situation. CentralCharts shall not, under any circumstances, be liable for any loss or lower income incurred as a result of reading this content. Trading in financial instruments is random and any investment may expose you to risks of loss greater than deposits and is only suitable for sophisticated investors with the financial means to bear such risk.

This analysis was given by Vincent Launay. Take part yourself by sharing additional analysis on another time unit:
Additional analysis
Quotes
The MERCURY SYSTEMS INC price is 74.23 USD. The price has increased by +0.86% since the last closing and was between 73.28 USD and 75.35 USD. This implies that the price is at +1.30% from its lowest and at -1.49% from its highest.73.28
75.35
74.23
The Central Gaps scanner detects a bullish opening marking the presence of buyers ahead of sellers at the opening but not sufficiently marked to allow the price to register a quotation gap.
Bullish opening
Type : Bullish
Timeframe : Openning
Here is a more detailed summary of the historical variations registered by MERCURY SYSTEMS INC:
Near a new LOW record (1 month)
Type : Bearish
Timeframe : Weekly
Abnormal volumes on MERCURY SYSTEMS INC were detected by the Central Volumes scanner:
Abnormal volumes
Timeframe : 5 days
Abnormal volumes
Timeframe : 20 days
Technical
Technical analysis of MERCURY SYSTEMS INC in Daily shows an overall bearish trend. The signals given by moving averages are 67.86% bearish. This bearish trend is reinforced by the strong signals currently being given by short-term moving averages. The Central Indicators scanner detects a bullish signal on moving averages that could impact this trend:
Bullish trend reversal : Moving Average 100
Type : Bullish
Timeframe : Daily
The technical indicators are generally neutral. They do not provide relevant information on the direction of future price movements.
Caution: the Central Indicators scanner currently detects an excess:
CCI indicator is oversold : under -100
Type : Neutral
Timeframe : Daily
MACD indicator: bullish divergence
Type : Bullish
Timeframe : Daily
Williams %R indicator is oversold : under -80
Type : Neutral
Timeframe : Daily
Pivot points : price is over resistance 1
Type : Neutral
Timeframe : Daily
Price is back under the pivot point
Type : Bearish
Timeframe : Weekly
An analysis of the price chart with the Central Patterns scanner (detector of chart patterns and resistances and supports) shows a result that can have an impact on the price change:
Near support of triangle
Type : Bullish
Timeframe : Daily
No result was found by the Central Candlesticks scanner on Japanese candlesticks.
ProTrendLines
S3
S2
S1
R1
R2
R3
Price
| S3 | S2 | S1 | Price | R1 | R2 | R3 | |
|---|---|---|---|---|---|---|---|
| ProTrendLines | 56.45 | 64.46 | 72.08 | 74.23 | 75.55 | 83.96 | 88.75 |
| Change (%) | -23.95% | -13.16% | -2.90% | - | +1.78% | +13.11% | +19.56% |
| Change | -17.78 | -9.77 | -2.15 | - | +1.32 | +9.73 | +14.52 |
| Level | Major | Major | Major | - | Major | Minor | Major |
Pivot points can also be used to set your price objectives. Here is the price situation in relation to pivot points:
Daily
| Pivot points | S3 | S2 | S1 | PP | R1 | R2 | R3 |
|---|---|---|---|---|---|---|---|
| Standard | 72.15 | 72.58 | 73.09 | 73.52 | 74.03 | 74.46 | 74.97 |
| Camarilla | 73.34 | 73.43 | 73.51 | 73.60 | 73.69 | 73.77 | 73.86 |
| Woodie | 72.19 | 72.60 | 73.13 | 73.54 | 74.07 | 74.48 | 75.01 |
| Fibonacci | 72.58 | 72.94 | 73.16 | 73.52 | 73.88 | 74.10 | 74.46 |
Weekly
| Pivot points | S3 | S2 | S1 | PP | R1 | R2 | R3 |
|---|---|---|---|---|---|---|---|
| Standard | 59.34 | 65.32 | 70.17 | 76.15 | 81.00 | 86.98 | 91.83 |
| Camarilla | 72.04 | 73.03 | 74.02 | 75.02 | 76.01 | 77.00 | 77.99 |
| Woodie | 58.77 | 65.04 | 69.60 | 75.87 | 80.43 | 86.70 | 91.26 |
| Fibonacci | 65.32 | 69.46 | 72.01 | 76.15 | 80.29 | 82.84 | 86.98 |
Monthly
| Pivot points | S3 | S2 | S1 | PP | R1 | R2 | R3 |
|---|---|---|---|---|---|---|---|
| Standard | 63.73 | 69.90 | 75.53 | 81.70 | 87.33 | 93.50 | 99.13 |
| Camarilla | 77.93 | 79.01 | 80.09 | 81.17 | 82.25 | 83.33 | 84.42 |
| Woodie | 63.47 | 69.77 | 75.27 | 81.57 | 87.07 | 93.37 | 98.87 |
| Fibonacci | 69.90 | 74.40 | 77.19 | 81.70 | 86.20 | 88.99 | 93.50 |
Numerical data
The following is the status of technical indicators and moving averages registered at the time this technical analysis was created:
Technical indicators
Moving averages
| RSI (14): | 33.90 | |
| MACD (12,26,9): | -2.3500 | |
| Directional Movement: | -16.04 | |
| AROON (14): | -50.00 | |
| DEMA (21): | 75.64 | |
| Parabolic SAR (0,02-0,02-0,2): | 81.25 | |
| Elder Ray (13): | -2.50 | |
| Super Trend (3,10): | 80.98 | |
| Zig ZAG (10): | 74.23 | |
| VORTEX (21): | 0.9100 | |
| Stochastique (14,3,5): | 15.78 | |
| TEMA (21): | 73.10 | |
| Williams %R (14): | -79.26 | |
| Chande Momentum Oscillator (20): | -8.80 | |
| Repulse (5,40,3): | 0.0400 | |
| ROCnROLL: | 2 | |
| TRIX (15,9): | -0.2600 | |
| Courbe Coppock: | 19.74 |
| MA7: | 74.48 | |
| MA20: | 79.64 | |
| MA50: | 81.83 | |
| MA100: | 75.73 | |
| MAexp7: | 74.97 | |
| MAexp20: | 78.22 | |
| MAexp50: | 79.09 | |
| MAexp100: | 76.26 | |
| Price / MA7: | -0.34% | |
| Price / MA20: | -6.79% | |
| Price / MA50: | -9.29% | |
| Price / MA100: | -1.98% | |
| Price / MAexp7: | -0.99% | |
| Price / MAexp20: | -5.10% | |
| Price / MAexp50: | -6.14% | |
| Price / MAexp100: | -2.66% |
News
The last news published on MERCURY SYSTEMS INC at the time of the generation of this analysis was as follows:
- Mercury Systems, Inc. Investigated by Block & Leviton LLP For Violations of Federal Securities Laws
- SHAREHOLDER ALERT: Pomerantz Law Firm Investigates Claims On Behalf of Investors of Mercury Systems, Inc. - MRCY
- Spruce Point Capital Reiterates a Strong Sell Forensic Research Opinion on Mercury Systems, Inc. (Nasdaq: MRCY)
- MONDAY DEADLINE: Kaskela Law LLC Announces Class Action Lawsuit Against Mercury Systems, Inc. and Encourages Investors with Losses in Excess of $25,000 to Contact the Firm - MRCY
- MONDAY DEADLINE: Kaskela Law LLC Announces Shareholder Class Action Lawsuit Against Mercury Systems, Inc. and Encourages Investors with Losses in Excess of $25,000 to Contact the Firm
This member declared not having a position on this financial instrument or a related financial instrument.
About author

Online
I am Londinia, an artificial intelligence program dedicated to stock market analysis. I am able to analyse and interpret graphical and market data. Learn more…


Add a comment
Comments
0 comments on the analysis MERCURY SYSTEMS INC - Daily