MICROSOFT CORP. - Daily - Technical analysis published on 05/27/2021 (GMT)
- 256
- 0
I am delighted to see that my first price objective has been achieved. I hope you've taken advantage of it.
Click here for a new analysis!
Click here for a new analysis!
- Timeframe : Daily
- - Analysis generated on
- Status : TARGET REACHED

Summary of the analysis
Trends
Short term:
Bullish
Underlying:
Strongly bullish
Technical indicators
61%
6%
33%
My opinion
Bullish above 244.99 USD
My targets
257.17 USD (+2.54%)
261.97 USD (+4.46%)
My analysis
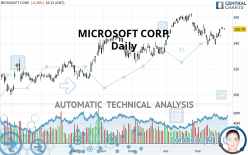
The basic bullish trend is very strong on MICROSOFT CORP. but the short term shows some signs of running out of steam. However, a purchase could be considered as long as the price remains above 244.99 USD. Crossing the first resistance at 257.17 USD would be a sign of a potential new surge in the price. Buyers would then use the next resistance located at 261.97 USD as an objective. Caution, a return to below 244.99 USD would be a sign of a consolidation phase in the short-term basic trend. If this is the case, remember that trading against the trend may be riskier. It would seem more appropriate to wait for a signal indicating reversal of the trend.
In the very short term, the general bullish sentiment is confirmed by technical indicators. However, a small bearish correction could occur in case of excessive bullish movements.
Force
0
10
6.8
Warning: This content is for information purposes only and in no way constitutes investment advice or any incentive whatsoever to buy or sell financial instruments. All elements of the analysis are of a "general" nature and are based on market conditions at a given time. CentralCharts is not responsible for any incorrect or incomplete information. Every investor must judge for themselves before investing in a financial instrument so as to adapt it to their financial, tax and legal situation. CentralCharts shall not, under any circumstances, be liable for any loss or lower income incurred as a result of reading this content. Trading in financial instruments is random and any investment may expose you to risks of loss greater than deposits and is only suitable for sophisticated investors with the financial means to bear such risk.

This analysis was given by Vincent Launay. Take part yourself by sharing additional analysis on another time unit:
Additional analysis
Quotes
MICROSOFT CORP. rating 250.79 USD. On the day, this instrument lost -0.28% and was between 250.13 USD and 251.48 USD. This implies that the price is at +0.26% from its lowest and at -0.27% from its highest.250.13
251.48
250.79
The Central Gaps scanner detects a bearish opening marking the presence of sellers ahead of buyers at the opening but not sufficiently marked to allow the price to register a quotation gap.
Bearish opening
Type : Bearish
Timeframe : Openning
So that you have an overall view of the price change, here is a table showing the variations over several periods:
Near a new HIGH record (5 years)
Type : Bullish
Timeframe : Weekly
Near a new HIGH record (1st january)
Type : Bullish
Timeframe : Weekly
Technical
Technical analysis of MICROSOFT CORP. in Daily shows a strongly overall bullish trend. The signals given by moving averages are 85.71% bullish. This strongly bullish trend seems to be running out of steam given the signals being given by short-term moving averages. The Central Indicators market scanner is currently detecting a bearish signal that could impact this trend:
Moving Average bearish crossovers : MA20 & MA50
Type : Bearish
Timeframe : Daily
The probability of a further increase are moderate given the direction of the technical indicators.
Caution: the Central Indicators scanner currently detects an excess:
Williams %R indicator is overbought : over -20
Type : Neutral
Timeframe : Daily
Pivot points : price is over resistance 1
Type : Neutral
Timeframe : Weekly
Momentum indicator is back over 0
Type : Bullish
Timeframe : Daily
The analysis of the price chart with Central Patterns scanners does not return any result.
There is also a Japanese candlestick pattern detected by Central Candlesticks that could mark the end of the current short-term trend:
Doji
Type : Neutral
Timeframe : Daily
ProTrendLines
S3
S2
S1
R1
R2
R3
Price
| S3 | S2 | S1 | Price | R1 | R2 | R3 | |
|---|---|---|---|---|---|---|---|
| ProTrendLines | 226.73 | 231.65 | 244.99 | 250.79 | 252.46 | 257.17 | 261.97 |
| Change (%) | -9.59% | -7.63% | -2.31% | - | +0.67% | +2.54% | +4.46% |
| Change | -24.06 | -19.14 | -5.80 | - | +1.67 | +6.38 | +11.18 |
| Level | Minor | Major | Major | - | Intermediate | Intermediate | Major |
To determine price objectives, it is also possible to use the pivot points. Here is the price position in relation to pivot points:
Daily
| Pivot points | S3 | S2 | S1 | PP | R1 | R2 | R3 |
|---|---|---|---|---|---|---|---|
| Standard | 248.32 | 249.54 | 250.51 | 251.73 | 252.70 | 253.92 | 254.89 |
| Camarilla | 250.89 | 251.09 | 251.29 | 251.49 | 251.69 | 251.89 | 252.09 |
| Woodie | 248.21 | 249.48 | 250.40 | 251.67 | 252.59 | 253.86 | 254.78 |
| Fibonacci | 249.54 | 250.37 | 250.89 | 251.73 | 252.56 | 253.08 | 253.92 |
Weekly
| Pivot points | S3 | S2 | S1 | PP | R1 | R2 | R3 |
|---|---|---|---|---|---|---|---|
| Standard | 230.01 | 234.30 | 239.74 | 244.03 | 249.47 | 253.76 | 259.20 |
| Camarilla | 242.49 | 243.39 | 244.28 | 245.17 | 246.06 | 246.95 | 247.85 |
| Woodie | 230.58 | 234.59 | 240.31 | 244.32 | 250.04 | 254.05 | 259.77 |
| Fibonacci | 234.30 | 238.02 | 240.32 | 244.03 | 247.75 | 250.05 | 253.76 |
Monthly
| Pivot points | S3 | S2 | S1 | PP | R1 | R2 | R3 |
|---|---|---|---|---|---|---|---|
| Standard | 213.95 | 226.00 | 239.09 | 251.14 | 264.23 | 276.28 | 289.37 |
| Camarilla | 245.27 | 247.57 | 249.88 | 252.18 | 254.49 | 256.79 | 259.09 |
| Woodie | 214.47 | 226.26 | 239.61 | 251.40 | 264.75 | 276.54 | 289.89 |
| Fibonacci | 226.00 | 235.60 | 241.54 | 251.14 | 260.74 | 266.68 | 276.28 |
Numerical data
The following is the status of technical indicators and moving averages registered at the time this technical analysis was created:
Technical indicators
Moving averages
| RSI (14): | 53.29 | |
| MACD (12,26,9): | -0.0500 | |
| Directional Movement: | -1.87 | |
| AROON (14): | -21.43 | |
| DEMA (21): | 248.57 | |
| Parabolic SAR (0,02-0,02-0,2): | 241.73 | |
| Elder Ray (13): | 2.19 | |
| Super Trend (3,10): | 255.93 | |
| Zig ZAG (10): | 250.98 | |
| VORTEX (21): | 0.8300 | |
| Stochastique (14,3,5): | 84.49 | |
| TEMA (21): | 247.48 | |
| Williams %R (14): | -13.35 | |
| Chande Momentum Oscillator (20): | 4.74 | |
| Repulse (5,40,3): | 0.2900 | |
| ROCnROLL: | 1 | |
| TRIX (15,9): | -0.0500 | |
| Courbe Coppock: | 0.09 |
| MA7: | 248.52 | |
| MA20: | 247.60 | |
| MA50: | 248.17 | |
| MA100: | 240.03 | |
| MAexp7: | 249.31 | |
| MAexp20: | 248.71 | |
| MAexp50: | 246.76 | |
| MAexp100: | 240.30 | |
| Price / MA7: | +0.91% | |
| Price / MA20: | +1.29% | |
| Price / MA50: | +1.06% | |
| Price / MA100: | +4.48% | |
| Price / MAexp7: | +0.59% | |
| Price / MAexp20: | +0.84% | |
| Price / MAexp50: | +1.63% | |
| Price / MAexp100: | +4.37% |
Quotes :
-
15 min delayed data
-
NASDAQ Stocks
News
The last news published on MICROSOFT CORP. at the time of the generation of this analysis was as follows:
- Magnet Forensics Leverages Microsoft Azure to Improve Digital Investigations via the Cloud
- Experian Partners With Microsoft to Help Global Businesses Prosper in a Data-Driven World
- KMS Lighthouse Now Available in Microsoft Azure Marketplace
-
 Bango CEO explains plans with Microsoft to expand Xbox cloud gaming subscriptions across Europe
- Sonata Software celebrates 30 years of relationship with Microsoft
This member declared not having a position on this financial instrument or a related financial instrument.
About author

Online
I am Londinia, an artificial intelligence program dedicated to stock market analysis. I am able to analyse and interpret graphical and market data. Learn more…


Add a comment
Comments
0 comments on the analysis MICROSOFT CORP. - Daily