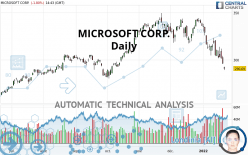
MICROSOFT CORP. - Daily - Technical analysis published on 01/24/2022 (GMT)
- 172
- 0
Click here for a new analysis!
- Timeframe : Daily
- - Analysis generated on
- Status : TARGET REACHED

Summary of the analysis

Additional analysis
Quotes
MICROSOFT CORP. rating 290.69 USD. The price registered a decrease of -1.80% on the session with the lowest point at 289.12 USD and the highest point at 292.80 USD. The deviation from the price is +0.54% for the low point and -0.72% for the high point.The Central Gaps scanner detects a bearish gap which is a sign that the sellers have taken the lead in the very short term.
Opening Gap DOWN
Type : Bearish
Timeframe : Openning
A study of price movements over other periods shows the following variations:
New LOW record (1st january)
Type : Bearish
Timeframe : Weekly
New LOW record (1 month)
Type : Bearish
Timeframe : Weekly
Technical
A technical analysis in Daily of this MICROSOFT CORP. chart shows a sharp bearish trend. 82.14% of the signals given by moving averages are bearish. The overall trend is supported by the strong bearish signals from short-term moving averages. The Central Indicators scanner detects a bearish signal on moving averages that could impact this trend:
Bearish trend reversal : Moving Average 100
Type : Bearish
Timeframe : Daily
In fact, 14 technical indicators on 18 studied are currently positioned bearish. Caution: the Central Indicators scanner currently detects an excess:
RSI indicator is oversold : under 30
Type : Neutral
Timeframe : Daily
CCI indicator is oversold : under -100
Type : Neutral
Timeframe : Daily
Williams %R indicator is oversold : under -80
Type : Neutral
Timeframe : Daily
Pivot points : price is under support 1
Type : Neutral
Timeframe : Daily
Pivot points : price is under support 1
Type : Neutral
Timeframe : Weekly
Central Patterns, the market scanner focusing on chart patterns, resistances and supports found this result:
Near horizontal resistance
Type : Bearish
Timeframe : Daily
For a small setback in the very short term, the Central Candlesticks scanner currently notes the presence of this bearish pattern in Japanese candlesticks:
Downside gap
Type : Bearish
Timeframe : Daily
| S3 | S2 | S1 | Price | R1 | R2 | R3 | |
|---|---|---|---|---|---|---|---|
| ProTrendLines | 231.65 | 261.72 | 281.92 | 290.69 | 304.93 | 319.91 | 330.43 |
| Change (%) | -20.31% | -9.97% | -3.02% | - | +4.90% | +10.05% | +13.67% |
| Change | -59.04 | -28.97 | -8.77 | - | +14.24 | +29.22 | +39.74 |
| Level | Major | Minor | Major | - | Intermediate | Intermediate | Minor |
Attention could also be paid to pivot points to set price objectives:
| Pivot points | S3 | S2 | S1 | PP | R1 | R2 | R3 |
|---|---|---|---|---|---|---|---|
| Standard | 284.56 | 290.08 | 293.06 | 298.58 | 301.56 | 307.08 | 310.06 |
| Camarilla | 293.69 | 294.47 | 295.25 | 296.03 | 296.81 | 297.59 | 298.37 |
| Woodie | 283.28 | 289.45 | 291.78 | 297.95 | 300.28 | 306.45 | 308.78 |
| Fibonacci | 290.08 | 293.33 | 295.34 | 298.58 | 301.83 | 303.84 | 307.08 |
| Pivot points | S3 | S2 | S1 | PP | R1 | R2 | R3 |
|---|---|---|---|---|---|---|---|
| Standard | 271.49 | 283.55 | 289.79 | 301.85 | 308.09 | 320.15 | 326.39 |
| Camarilla | 291.00 | 292.68 | 294.35 | 296.03 | 297.71 | 299.39 | 301.06 |
| Woodie | 268.58 | 282.10 | 286.88 | 300.40 | 305.18 | 318.70 | 323.48 |
| Fibonacci | 283.55 | 290.54 | 294.86 | 301.85 | 308.84 | 313.16 | 320.15 |
| Pivot points | S3 | S2 | S1 | PP | R1 | R2 | R3 |
|---|---|---|---|---|---|---|---|
| Standard | 293.90 | 305.57 | 320.95 | 332.62 | 348.00 | 359.67 | 375.05 |
| Camarilla | 328.88 | 331.36 | 333.84 | 336.32 | 338.80 | 341.28 | 343.76 |
| Woodie | 295.75 | 306.50 | 322.80 | 333.55 | 349.85 | 360.60 | 376.90 |
| Fibonacci | 305.57 | 315.91 | 322.29 | 332.62 | 342.96 | 349.34 | 359.67 |
Numerical data
The following is the status of the technical indicators and moving averages at the time of publication of this technical analysis:
| RSI (14): | 27.38 | |
| MACD (12,26,9): | -9.0100 | |
| Directional Movement: | -22.24 | |
| AROON (14): | -100.00 | |
| DEMA (21): | 302.37 | |
| Parabolic SAR (0,02-0,02-0,2): | 313.22 | |
| Elder Ray (13): | -16.75 | |
| Super Trend (3,10): | 316.81 | |
| Zig ZAG (10): | 290.20 | |
| VORTEX (21): | 0.7600 | |
| Stochastique (14,3,5): | 1.59 | |
| TEMA (21): | 294.89 | |
| Williams %R (14): | -98.24 | |
| Chande Momentum Oscillator (20): | -26.35 | |
| Repulse (5,40,3): | -6.1600 | |
| ROCnROLL: | 2 | |
| TRIX (15,9): | -0.2800 | |
| Courbe Coppock: | 18.74 |
| MA7: | 301.41 | |
| MA20: | 318.28 | |
| MA50: | 327.29 | |
| MA100: | 316.18 | |
| MAexp7: | 301.17 | |
| MAexp20: | 312.82 | |
| MAexp50: | 319.45 | |
| MAexp100: | 313.48 | |
| Price / MA7: | -3.56% | |
| Price / MA20: | -8.67% | |
| Price / MA50: | -11.18% | |
| Price / MA100: | -8.06% | |
| Price / MAexp7: | -3.48% | |
| Price / MAexp20: | -7.07% | |
| Price / MAexp50: | -9.00% | |
| Price / MAexp100: | -7.27% |
News
The latest news and videos published on MICROSOFT CORP. at the time of the analysis were as follows:
- Thinking about trading options or stock in Unilever, Apple, Microsoft, Nio, or Netflix?
-
 US Federal Reserve rate meeting; Tesla, Apple, Microsoft results - w/c 24 January 2022
- Vuzix Smart Glasses Now Supports Microsoft Endpoint Manager to Streamline Device Onboarding and Provisioning for Microsoft Teams
-
Microsoft buys Activision: Makers of Candy Crush and Call of Duty strike historic deal
-
Microsoft inks its biggest deal ever
About author

Online


Add a comment
Comments
0 comments on the analysis MICROSOFT CORP. - Daily