MICROSOFT CORP. - Weekly - Technical analysis published on 05/09/2022 (GMT)
- Who voted?
- 270
- 0
Click here for a new analysis!
- Timeframe : Weekly
- - Analysis generated on
- Status : INVALID
Summary of the analysis

Additional analysis
Quotes
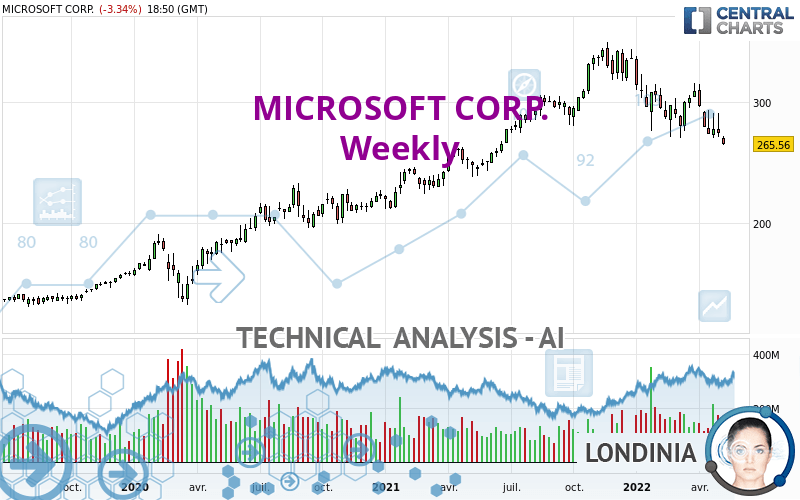
The MICROSOFT CORP. rating is 265.55 USD. Over 5 days, this instrument lost -6.65% and was traded between 271.27 USD and 286.35 USD over the period. The price is currently at -2.11% from its lowest point and -7.26% from its highest point.A bearish gap was detected at the opening by the Central Gaps scanner. There are a lot of sellers and they have the upper hand in the very short term.
Opening Gap DOWN
Type : Bearish
Timeframe : Openning
Here is a more detailed summary of the historical variations registered by MICROSOFT CORP.:
New LOW record (1st january)
Type : Bearish
Timeframe : Weekly
New LOW record (1 month)
Type : Bearish
Timeframe : Weekly
Technical
Technical analysis of this Weekly chart of MICROSOFT CORP. indicates that the overall trend is slightly bullish. 53.57% of the signals given by moving averages are bullish. Caution: a reversal of the trend could be possible given the strong bearish signals of short-term moving averages. The Central Indicators market scanner is currently detecting several bearish signals that could impact this trend:
Moving Average bearish crossovers : MA20 & MA50
Type : Bearish
Timeframe : Weekly
Moving Average bearish crossovers : AMA20 & AMA50
Type : Bearish
Timeframe : Weekly
An assessment of technical indicators shows a bearish signal.
Caution: the Central Indicators scanner currently detects an excess:
CCI indicator is oversold : under -100
Type : Neutral
Timeframe : Weekly
Williams %R indicator is oversold : under -80
Type : Neutral
Timeframe : Weekly
Pivot points : price is under support 1
Type : Neutral
Timeframe : Weekly
Ichimoku : price is under the cloud
Type : Bearish
Timeframe : Weekly
Central Patterns, the market scanner focusing on chart patterns, resistances and supports found these results:
Near horizontal resistance
Type : Bearish
Timeframe : Weekly
Near support of channel
Type : Bullish
Timeframe : Weekly
No result was found by the Central Candlesticks scanner on Japanese candlesticks.
| S3 | S2 | S1 | Price | R1 | R2 | R3 | |
|---|---|---|---|---|---|---|---|
| ProTrendLines | 132.97 | 184.79 | 228.65 | 265.55 | 280.82 | 315.41 | 342.40 |
| Change (%) | -49.93% | -30.41% | -13.90% | - | +5.75% | +18.78% | +28.94% |
| Change | -132.58 | -80.76 | -36.90 | - | +15.27 | +49.86 | +76.85 |
| Level | Major | Intermediate | Minor | - | Major | Major | Major |
Attention could also be paid to pivot points to set price objectives:
| Pivot points | S3 | S2 | S1 | PP | R1 | R2 | R3 |
|---|---|---|---|---|---|---|---|
| Standard | 262.94 | 267.10 | 270.92 | 275.08 | 278.90 | 283.06 | 286.88 |
| Camarilla | 272.54 | 273.27 | 274.00 | 274.73 | 275.46 | 276.19 | 276.93 |
| Woodie | 262.76 | 267.02 | 270.74 | 275.00 | 278.72 | 282.98 | 286.70 |
| Fibonacci | 267.10 | 270.15 | 272.04 | 275.08 | 278.13 | 280.02 | 283.06 |
| Pivot points | S3 | S2 | S1 | PP | R1 | R2 | R3 |
|---|---|---|---|---|---|---|---|
| Standard | 247.43 | 259.35 | 267.04 | 278.96 | 286.65 | 298.57 | 306.26 |
| Camarilla | 269.34 | 271.14 | 272.93 | 274.73 | 276.53 | 278.33 | 280.12 |
| Woodie | 245.32 | 258.29 | 264.93 | 277.90 | 284.54 | 297.51 | 304.15 |
| Fibonacci | 259.35 | 266.84 | 271.47 | 278.96 | 286.45 | 291.08 | 298.57 |
| Pivot points | S3 | S2 | S1 | PP | R1 | R2 | R3 |
|---|---|---|---|---|---|---|---|
| Standard | 214.87 | 242.43 | 259.98 | 287.54 | 305.09 | 332.65 | 350.20 |
| Camarilla | 265.12 | 269.25 | 273.39 | 277.52 | 281.66 | 285.79 | 289.93 |
| Woodie | 209.86 | 239.93 | 254.97 | 285.04 | 300.08 | 330.15 | 345.19 |
| Fibonacci | 242.43 | 259.67 | 270.31 | 287.54 | 304.78 | 315.42 | 332.65 |
Numerical data
The following is the status of the technical indicators and moving averages at the time of publication of this technical analysis:
| RSI (14): | 37.72 | |
| MACD (12,26,9): | -7.6100 | |
| Directional Movement: | -17.72 | |
| AROON (14): | -42.86 | |
| DEMA (21): | 284.07 | |
| Parabolic SAR (0,02-0,02-0,2): | 311.56 | |
| Elder Ray (13): | -18.10 | |
| Super Trend (3,10): | 321.40 | |
| Zig ZAG (10): | 266.00 | |
| VORTEX (21): | 0.8600 | |
| Stochastique (14,3,5): | 9.58 | |
| TEMA (21): | 271.55 | |
| Williams %R (14): | -97.63 | |
| Chande Momentum Oscillator (20): | -22.20 | |
| Repulse (5,40,3): | -8.2400 | |
| ROCnROLL: | 2 | |
| TRIX (15,9): | -0.1800 | |
| Courbe Coppock: | 16.85 |
| MA7: | 278.85 | |
| MA20: | 280.85 | |
| MA50: | 291.02 | |
| MA100: | 300.75 | |
| MAexp7: | 279.01 | |
| MAexp20: | 291.40 | |
| MAexp50: | 287.21 | |
| MAexp100: | 259.41 | |
| Price / MA7: | -4.77% | |
| Price / MA20: | -5.45% | |
| Price / MA50: | -8.75% | |
| Price / MA100: | -11.70% | |
| Price / MAexp7: | -4.82% | |
| Price / MAexp20: | -8.87% | |
| Price / MAexp50: | -7.54% | |
| Price / MAexp100: | +2.37% |
News
Don't forget to follow the news on MICROSOFT CORP.. At the time of publication of this analysis, the latest news was as follows:
- Avaya Enters Strategic Partnership with Microsoft to Deliver Avaya OneCloud™ Solutions on Microsoft Azure
- Thinking about trading options or stock in Block, Microsoft, Tesla, Nokia, or Twitter?
- AES Expands Renewable Energy Agreement with Microsoft to California Data Centers
- Microsoft announces general availability of Microsoft Defender for Business designed to boost small and medium business (SMB) security
- Microsoft earnings press release available on Investor Relations website
About author

Online


Add a comment
Comments
0 comments on the analysis MICROSOFT CORP. - Weekly