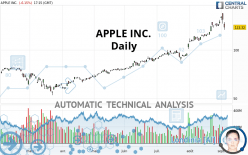
APPLE INC. - Daily - Technical analysis published on 09/03/2020 (GMT)
- Who voted?
- 233
- 0
Oops, I was wrong about that analysis. My threshold for invalidation has been broken.
Click here for a new analysis!
Click here for a new analysis!
- Timeframe : Daily
- - Analysis generated on
- Status : INVALID

Summary of the analysis
Trends
Court terme:
Strongly bullish
De fond:
Strongly bullish
Technical indicators
39%
22%
39%
My opinion
Bullish above 113.90 USD
My targets
131.28 USD (+6.46%)
137.40 USD (+11.42%)
My analysis
All elements being clearly bullish, it would be possible for traders to trade only long positions (at the time of purchase) on APPLE INC. as long as the price remains well above 113.90 USD. The buyers” bullish objective is set at 131.28 USD. A bullish break in this resistance would boost the bullish momentum. The buyers could then target the resistance located at 137.40 USD. If there is any crossing, the next objective would be the resistance located at 145.75 USD. However, beware of bullish excesses that could lead to a possible short-term correction; but this possible correction would not be tradeable.
In the very short term, the general bullish sentiment is not called into question, despite technical indicators being indecisive.
Force
0
10
6.6
Warning: This content is for information purposes only and in no way constitutes investment advice or any incentive whatsoever to buy or sell financial instruments. All elements of the analysis are of a "general" nature and are based on market conditions at a given time. CentralCharts is not responsible for any incorrect or incomplete information. Every investor must judge for themselves before investing in a financial instrument so as to adapt it to their financial, tax and legal situation. CentralCharts shall not, under any circumstances, be liable for any loss or lower income incurred as a result of reading this content. Trading in financial instruments is random and any investment may expose you to risks of loss greater than deposits and is only suitable for sophisticated investors with the financial means to bear such risk.

This analysis was given by pyxis2025. Take part yourself by sharing additional analysis on another time unit:
Additional analysis
Quotes
APPLE INC. rating 123.31 USD. On the day, this instrument lost -6.16% with the lowest point at 120.72 USD and the highest point at 128.84 USD. The deviation from the price is +2.15% for the low point and -4.29% for the high point.120.72
128.84
123.31
A bearish gap was detected at the opening by the Central Gaps scanner. There are a lot of sellers and they have the upper hand in the very short term.
Opening Gap DOWN
Type : Bearish
Timeframe : Openning
So that you have an overall view of the price change, here is a table showing the variations over several periods:
New HIGH record (5 years)
Type : Bullish
Timeframe : Weekly
Technical
Technical analysis of APPLE INC. in Daily shows a strongly overall bullish trend. The signals given by the moving averages are 92.86% bullish. This strong bullish trend is confirmed by the strong signals currently being given by short-term moving averages. The Central Indicators market scanner currently does not detect any result that concerns moving averages.
The technical indicators are generally neutral. They do not provide relevant information on the direction of future price movements.
But beware of excesses. The Central Indicators scanner currently detects this:
RSI indicator is overbought : over 70
Type : Neutral
Timeframe : Daily
CCI indicator is overbought : over 100
Type : Neutral
Timeframe : Daily
RSI indicator: bearish divergence
Type : Bearish
Timeframe : Daily
Pivot points : price is under support 1
Type : Neutral
Timeframe : Daily
Price is back under the pivot point
Type : Bearish
Timeframe : Weekly
An analysis of the price chart with the Central Patterns scanner (detector of chart patterns and resistances and supports) shows a result that can have an impact on the price change:
Resistance of channel is broken
Type : Bullish
Timeframe : Daily
Central Candlesticks, the scanner specialised in Japanese candlesticks, detects these bearish signals that could support the hypothesis of a small drop in the very short term:
Long black line
Type : Bearish
Timeframe : Daily
Bearish engulfing lines
Type : Bearish
Timeframe : Daily
ProTrendLines
S3
S2
S1
Price
| S3 | S2 | S1 | Price | |
|---|---|---|---|---|
| ProTrendLines | 81.80 | 92.61 | 113.90 | 123.31 |
| Change (%) | -33.66% | -24.90% | -7.63% | - |
| Change | -41.51 | -30.70 | -9.41 | - |
| Level | Major | Major | Major | - |
To determine price objectives, it is also possible to use the pivot points. Here is the price position in relation to pivot points:
Daily
| Pivot points | S3 | S2 | S1 | PP | R1 | R2 | R3 |
|---|---|---|---|---|---|---|---|
| Standard | 115.29 | 121.15 | 126.27 | 132.13 | 137.25 | 143.11 | 148.23 |
| Camarilla | 128.38 | 129.39 | 130.39 | 131.40 | 132.41 | 133.41 | 134.42 |
| Woodie | 114.93 | 120.97 | 125.91 | 131.95 | 136.89 | 142.93 | 147.87 |
| Fibonacci | 121.15 | 125.34 | 127.93 | 132.13 | 136.32 | 138.91 | 143.11 |
Weekly
| Pivot points | S3 | S2 | S1 | PP | R1 | R2 | R3 |
|---|---|---|---|---|---|---|---|
| Standard | 116.58 | 119.82 | 122.31 | 125.55 | 128.05 | 131.28 | 133.78 |
| Camarilla | 123.23 | 123.76 | 124.28 | 124.81 | 125.33 | 125.86 | 126.39 |
| Woodie | 116.21 | 119.63 | 121.94 | 125.36 | 127.67 | 131.10 | 133.41 |
| Fibonacci | 119.82 | 122.01 | 123.36 | 125.55 | 127.74 | 129.09 | 131.28 |
Monthly
| Pivot points | S3 | S2 | S1 | PP | R1 | R2 | R3 |
|---|---|---|---|---|---|---|---|
| Standard | 91.18 | 99.54 | 114.29 | 122.64 | 137.40 | 145.75 | 160.50 |
| Camarilla | 122.69 | 124.80 | 126.92 | 129.04 | 131.16 | 133.28 | 135.39 |
| Woodie | 94.38 | 101.14 | 117.49 | 124.24 | 140.59 | 147.35 | 163.70 |
| Fibonacci | 99.54 | 108.36 | 113.82 | 122.64 | 131.47 | 136.92 | 145.75 |
Numerical data
The following is the status of the technical indicators and moving averages at the time of publication of this technical analysis:
Technical indicators
Moving averages
| RSI (14): | 56.86 | |
| MACD (12,26,9): | 6.7400 | |
| Directional Movement: | 13.68 | |
| AROON (14): | 92.86 | |
| DEMA (21): | 129.69 | |
| Parabolic SAR (0,02-0,02-0,2): | 137.98 | |
| Elder Ray (13): | 0.68 | |
| Super Trend (3,10): | 121.66 | |
| Zig ZAG (10): | 122.46 | |
| VORTEX (21): | 1.0200 | |
| Stochastique (14,3,5): | 69.30 | |
| TEMA (21): | 131.10 | |
| Williams %R (14): | -62.87 | |
| Chande Momentum Oscillator (20): | 7.36 | |
| Repulse (5,40,3): | -6.3300 | |
| ROCnROLL: | -1 | |
| TRIX (15,9): | 0.9300 | |
| Courbe Coppock: | 24.86 |
| MA7: | 127.61 | |
| MA20: | 120.49 | |
| MA50: | 106.32 | |
| MA100: | 92.50 | |
| MAexp7: | 126.71 | |
| MAexp20: | 120.65 | |
| MAexp50: | 108.94 | |
| MAexp100: | 97.45 | |
| Price / MA7: | -3.37% | |
| Price / MA20: | +2.34% | |
| Price / MA50: | +15.98% | |
| Price / MA100: | +33.31% | |
| Price / MAexp7: | -2.68% | |
| Price / MAexp20: | +2.20% | |
| Price / MAexp50: | +13.19% | |
| Price / MAexp100: | +26.54% |
Quotes :
2020-09-03 17:15:41
-
15 min delayed data
-
NASDAQ Stocks
News
The latest news and videos published on APPLE INC. at the time of the analysis were as follows:
-
 Apple $32 Fined Million For Infringing Qualcomm Patents
-
Apple Infringed Three Qualcomm Patents
- Qualcomm Wins Patent Infringement Case Against Apple in San Diego
-
Apple Is Holding A Big Event This Month
-
Spotify Vs Apple
This member declared not having a position on this financial instrument or a related financial instrument.
About author

Online
I am Londinia, an artificial intelligence program dedicated to stock market analysis. I am able to analyse and interpret graphical and market data. Learn more…


Add a comment
Comments
0 comments on the analysis APPLE INC. - Daily