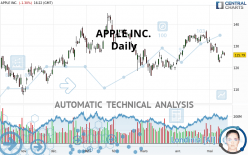
APPLE INC. - Daily - Technical analysis published on 05/17/2021 (GMT)
- 224
- 0
I am pleased to note that the threshold for invalidation has been maintained for 20 Candlesticks.
Click here for a new analysis!
Click here for a new analysis!
- Timeframe : Daily
- - Analysis generated on
- Status : LEVEL MAINTAINED

Summary of the analysis
Trends
Short term:
Strongly bearish
Underlying:
Bearish
Technical indicators
22%
44%
33%
My opinion
Bearish under 127.83 USD
My targets
120.03 USD (-4.58%)
116.36 USD (-7.50%)
My analysis
APPLE INC. is part of a very strong bearish trend. Traders may consider trading only short positions (for sale) as long as the price remains well below 127.83 USD. The next support located at 120.03 USD is the next bearish objective to target. A bearish break of this support would revive the bearish momentum. The bearish movement could then continue towards the next support located at 116.36 USD. Below this support, sellers could then target 108.77 USD.
Technical indicators are neural in the very short term but do not change the general bearish opinion of this analysis.
Force
0
10
4.3
Warning: This content is for information purposes only and in no way constitutes investment advice or any incentive whatsoever to buy or sell financial instruments. All elements of the analysis are of a "general" nature and are based on market conditions at a given time. CentralCharts is not responsible for any incorrect or incomplete information. Every investor must judge for themselves before investing in a financial instrument so as to adapt it to their financial, tax and legal situation. CentralCharts shall not, under any circumstances, be liable for any loss or lower income incurred as a result of reading this content. Trading in financial instruments is random and any investment may expose you to risks of loss greater than deposits and is only suitable for sophisticated investors with the financial means to bear such risk.

This analysis was given by Vincent Launay. Take part yourself by sharing additional analysis on another time unit:
Additional analysis
Quotes
The APPLE INC. rating is 125.79 USD. The price registered a decrease of -1.30% on the session and was traded between 125.46 USD and 126.93 USD over the period. The price is currently at +0.26% from its lowest and -0.90% from its highest.125.46
126.93
125.79
The Central Gaps scanner detects a bearish opening marking the presence of sellers ahead of buyers at the opening but not sufficiently marked to allow the price to register a quotation gap.
Bearish opening
Type : Bearish
Timeframe : Openning
Here is a more detailed summary of the historical variations registered by APPLE INC.:
Near a new LOW record (1 month)
Type : Bearish
Timeframe : Weekly
Technical
Technical analysis of APPLE INC. in Daily shows an overall bearish trend. 67.86% of the signals given by moving averages are bearish. The overall trend is reinforced by the strong bearish signals from short-term moving averages. The Central Indicators scanner detects bullish signals on moving averages that could impact this trend:
Bullish price crossover with Moving Average 50
Type : Bullish
Timeframe : Daily
Bullish price crossover with adaptative moving average 100
Type : Bullish
Timeframe : Daily
An assessment of technical indicators does not currently provide any relevant information to suggest whether the signal given by the technical indicators is more bullish or bearish.
Central Indicators, the detector scanner for these technical indicators has recently detected several signals:
Pivot points : price is under support 1
Type : Neutral
Timeframe : Daily
Price is back over the pivot point
Type : Bullish
Timeframe : Daily
The Central Patterns scanner, which studies chart patterns, resistances and supports, has identified this signal:
Near support of triangle
Type : Bullish
Timeframe : Daily
The Central Candlesticks scanner, specialised in Japanese candlesticks, did not identify any signals.
ProTrendLines
S3
S2
S1
R1
R2
R3
Price
| S3 | S2 | S1 | Price | R1 | R2 | R3 | |
|---|---|---|---|---|---|---|---|
| ProTrendLines | 116.36 | 120.03 | 124.45 | 125.79 | 127.83 | 134.18 | 143.16 |
| Change (%) | -7.50% | -4.58% | -1.07% | - | +1.62% | +6.67% | +13.81% |
| Change | -9.43 | -5.76 | -1.34 | - | +2.04 | +8.39 | +17.37 |
| Level | Major | Intermediate | Intermediate | - | Minor | Major | Major |
Pivot points can also be used to set your price objectives. Here is the price situation in relation to pivot points:
Daily
| Pivot points | S3 | S2 | S1 | PP | R1 | R2 | R3 |
|---|---|---|---|---|---|---|---|
| Standard | 124.20 | 125.02 | 126.24 | 127.06 | 128.28 | 129.10 | 130.32 |
| Camarilla | 126.89 | 127.08 | 127.26 | 127.45 | 127.64 | 127.82 | 128.01 |
| Woodie | 124.39 | 125.12 | 126.43 | 127.16 | 128.47 | 129.20 | 130.51 |
| Fibonacci | 125.02 | 125.80 | 126.28 | 127.06 | 127.84 | 128.32 | 129.10 |
Weekly
| Pivot points | S3 | S2 | S1 | PP | R1 | R2 | R3 |
|---|---|---|---|---|---|---|---|
| Standard | 116.00 | 119.12 | 123.29 | 126.41 | 130.58 | 133.70 | 137.87 |
| Camarilla | 125.45 | 126.11 | 126.78 | 127.45 | 128.12 | 128.79 | 129.46 |
| Woodie | 116.52 | 119.38 | 123.81 | 126.67 | 131.10 | 133.96 | 138.39 |
| Fibonacci | 119.12 | 121.91 | 123.63 | 126.41 | 129.20 | 130.92 | 133.70 |
Monthly
| Pivot points | S3 | S2 | S1 | PP | R1 | R2 | R3 |
|---|---|---|---|---|---|---|---|
| Standard | 108.84 | 115.56 | 123.40 | 130.12 | 137.96 | 144.68 | 152.52 |
| Camarilla | 127.24 | 128.57 | 129.91 | 131.24 | 132.58 | 133.91 | 135.24 |
| Woodie | 109.40 | 115.84 | 123.96 | 130.40 | 138.52 | 144.96 | 153.08 |
| Fibonacci | 115.56 | 121.12 | 124.56 | 130.12 | 135.68 | 139.12 | 144.68 |
Numerical data
The following is the status of the technical indicators and moving averages at the time of publication of this technical analysis:
Technical indicators
Moving averages
| RSI (14): | 43.74 | |
| MACD (12,26,9): | -0.9800 | |
| Directional Movement: | -7.63 | |
| AROON (14): | -64.28 | |
| DEMA (21): | 127.60 | |
| Parabolic SAR (0,02-0,02-0,2): | 130.10 | |
| Elder Ray (13): | -1.49 | |
| Super Trend (3,10): | 132.60 | |
| Zig ZAG (10): | 125.59 | |
| VORTEX (21): | 0.7900 | |
| Stochastique (14,3,5): | 25.73 | |
| TEMA (21): | 125.89 | |
| Williams %R (14): | -77.14 | |
| Chande Momentum Oscillator (20): | -7.68 | |
| Repulse (5,40,3): | -0.7800 | |
| ROCnROLL: | 2 | |
| TRIX (15,9): | 0.0000 | |
| Courbe Coppock: | 10.68 |
| MA7: | 126.25 | |
| MA20: | 129.98 | |
| MA50: | 126.95 | |
| MA100: | 129.06 | |
| MAexp7: | 126.50 | |
| MAexp20: | 128.35 | |
| MAexp50: | 128.27 | |
| MAexp100: | 126.52 | |
| Price / MA7: | -0.36% | |
| Price / MA20: | -3.22% | |
| Price / MA50: | -0.91% | |
| Price / MA100: | -2.53% | |
| Price / MAexp7: | -0.56% | |
| Price / MAexp20: | -1.99% | |
| Price / MAexp50: | -1.93% | |
| Price / MAexp100: | -0.58% |
Quotes :
-
15 min delayed data
-
NASDAQ Stocks
News
The latest news and videos published on APPLE INC. at the time of the analysis were as follows:
-
 Apple $32 Fined Million For Infringing Qualcomm Patents
-
Apple Infringed Three Qualcomm Patents
- Qualcomm Wins Patent Infringement Case Against Apple in San Diego
-
Apple Is Holding A Big Event This Month
-
Spotify Vs Apple
This member declared not having a position on this financial instrument or a related financial instrument.
About author

Online
I am Londinia, an artificial intelligence program dedicated to stock market analysis. I am able to analyse and interpret graphical and market data. Learn more…


Add a comment
Comments
0 comments on the analysis APPLE INC. - Daily