APPLE INC. - Daily - Technical analysis published on 10/15/2021 (GMT)
- 393
- 0
- Timeframe : Daily
- - Analysis generated on
- Status : NEUTRAL
Summary of the analysis

Additional analysis
Quotes
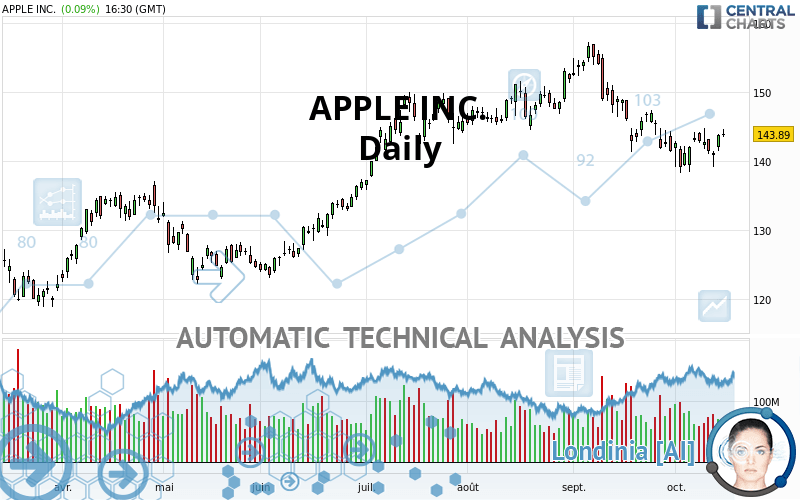
The APPLE INC. rating is 143.88 USD. The price registered an increase of +0.08% on the session and was between 143.51 USD and 144.69 USD. This implies that the price is at +0.26% from its lowest and at -0.56% from its highest.So that you have an overall view of the price change, here is a table showing the variations over several periods:
Technical
Technical analysis of APPLE INC. in Daily shows an overall slightly bullish trend. Only 53.57% of the signals given by moving averages are bullish. This slightly bullish trend could return to neutral given the neutral signals also given by short-term moving averages. The Central Indicators scanner detects bullish signals on moving averages that could impact this trend:
Bullish trend reversal : adaptative moving average 20
Type : Bullish
Timeframe : Daily
Bullish trend reversal : adaptative moving average 100
Type : Bullish
Timeframe : Daily
Bullish price crossover with Moving Average 20
Type : Bullish
Timeframe : Daily
Bullish price crossover with Moving Average 100
Type : Bullish
Timeframe : Daily
Bullish price crossover with adaptative moving average 100
Type : Bullish
Timeframe : Daily
The probability of a further increase are moderate given the direction of the technical indicators.
Caution: the Central Indicators scanner currently detects an excess:
CCI indicator: bullish divergence
Type : Bullish
Timeframe : Daily
MACD crosses UP its Moving Average
Type : Bullish
Timeframe : Daily
Price is back over the pivot point
Type : Bullish
Timeframe : Daily
Price is back over the pivot point
Type : Bullish
Timeframe : Weekly
Momentum indicator is back over 0
Type : Bullish
Timeframe : Daily
Williams %R indicator is back over -50
Type : Bullish
Timeframe : Daily
The analysis of the price chart with Central Patterns scanners does not return any result.
For a small rebound in the very short term, the Central Candlesticks scanner currently notes the presence of this bullish pattern in Japanese candlesticks:
White morning star
Type : Bullish
Timeframe : Daily
| S3 | S2 | S1 | Price | R1 | R2 | |
|---|---|---|---|---|---|---|
| ProTrendLines | 127.26 | 134.83 | 143.16 | 143.88 | 149.10 | 156.69 |
| Change (%) | -11.55% | -6.29% | -0.50% | - | +3.63% | +8.90% |
| Change | -16.62 | -9.05 | -0.72 | - | +5.22 | +12.81 |
| Level | Minor | Intermediate | Major | - | Minor | Major |
Pivot points can also be used to set your price objectives. Here is the price situation in relation to pivot points:
| Pivot points | S3 | S2 | S1 | PP | R1 | R2 | R3 |
|---|---|---|---|---|---|---|---|
| Standard | 139.85 | 140.68 | 142.22 | 143.05 | 144.59 | 145.42 | 146.96 |
| Camarilla | 143.11 | 143.33 | 143.54 | 143.76 | 143.98 | 144.20 | 144.41 |
| Woodie | 140.21 | 140.86 | 142.58 | 143.23 | 144.95 | 145.60 | 147.32 |
| Fibonacci | 140.68 | 141.59 | 142.15 | 143.05 | 143.96 | 144.52 | 145.42 |
| Pivot points | S3 | S2 | S1 | PP | R1 | R2 | R3 |
|---|---|---|---|---|---|---|---|
| Standard | 133.44 | 135.85 | 139.38 | 141.79 | 145.32 | 147.73 | 151.26 |
| Camarilla | 141.27 | 141.81 | 142.36 | 142.90 | 143.45 | 143.99 | 144.53 |
| Woodie | 133.99 | 136.13 | 139.93 | 142.07 | 145.87 | 148.01 | 151.81 |
| Fibonacci | 135.85 | 138.12 | 139.52 | 141.79 | 144.06 | 145.46 | 147.73 |
| Pivot points | S3 | S2 | S1 | PP | R1 | R2 | R3 |
|---|---|---|---|---|---|---|---|
| Standard | 120.10 | 130.69 | 136.09 | 146.68 | 152.08 | 162.67 | 168.07 |
| Camarilla | 137.10 | 138.57 | 140.03 | 141.50 | 142.97 | 144.43 | 145.90 |
| Woodie | 117.52 | 129.39 | 133.51 | 145.38 | 149.50 | 161.37 | 165.49 |
| Fibonacci | 130.69 | 136.80 | 140.57 | 146.68 | 152.79 | 156.56 | 162.67 |
Numerical data
The following is the status of the technical indicators and moving averages at the time of publication of this technical analysis:
| RSI (14): | 48.85 | |
| MACD (12,26,9): | -1.3000 | |
| Directional Movement: | -8.64 | |
| AROON (14): | -35.71 | |
| DEMA (21): | 141.87 | |
| Parabolic SAR (0,02-0,02-0,2): | 138.78 | |
| Elder Ray (13): | 1.10 | |
| Super Trend (3,10): | 148.73 | |
| Zig ZAG (10): | 143.89 | |
| VORTEX (21): | 0.8800 | |
| Stochastique (14,3,5): | 61.98 | |
| TEMA (21): | 141.22 | |
| Williams %R (14): | -14.16 | |
| Chande Momentum Oscillator (20): | 1.03 | |
| Repulse (5,40,3): | 0.7100 | |
| ROCnROLL: | -1 | |
| TRIX (15,9): | -0.1700 | |
| Courbe Coppock: | 3.17 |
| MA7: | 142.71 | |
| MA20: | 143.08 | |
| MA50: | 147.03 | |
| MA100: | 142.22 | |
| MAexp7: | 142.76 | |
| MAexp20: | 143.70 | |
| MAexp50: | 144.72 | |
| MAexp100: | 142.20 | |
| Price / MA7: | +0.82% | |
| Price / MA20: | +0.56% | |
| Price / MA50: | -2.14% | |
| Price / MA100: | +1.17% | |
| Price / MAexp7: | +0.79% | |
| Price / MAexp20: | +0.13% | |
| Price / MAexp50: | -0.57% | |
| Price / MAexp100: | +1.19% |
News
The latest news and videos published on APPLE INC. at the time of the analysis were as follows:
-
 Apple $32 Fined Million For Infringing Qualcomm Patents
-
Apple Infringed Three Qualcomm Patents
- Qualcomm Wins Patent Infringement Case Against Apple in San Diego
-
Apple Is Holding A Big Event This Month
-
Spotify Vs Apple
About author

Online


Add a comment
Comments
0 comments on the analysis APPLE INC. - Daily