APPLE INC. - On The Way to Reach Its Previous High at $118.70 - 12/20/2016 (GMT)
- Who voted?
- 795
- 0
- Timeframe : Daily

APPLE INC. Chart
Are you looking for opportunities in American stocks?
DISCOVER LONDINIA OPPORTUNITIES...
DISCOVER LONDINIA OPPORTUNITIES...
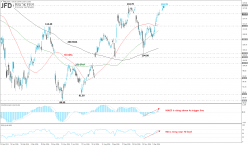
The Apple Inc. (NASDAQ: AAPL) has been in an uptrend since June 2016 rising 24.6% up to $118.70 before it had a big retracement down to $104.00, finding support on the aforementioned psychological level and the 200-SMA on the daily chart. Looking to the most recent candles, the stock recorded eight straight winning days surpassing both the 50 and the 100 SMAs on the daily chart while during yesterday’s session created the first negative day.
The stock surpassed the $116.20 strong barrier and the successful penetration of $116.20 will bolster the price up to $118.70, the previous high. The RSI is rising towards its 70 level, though with strong momentum while the MACD oscillator is rising above its trigger line, in the positive territory endorsing our bullish view.
The stock surpassed the $116.20 strong barrier and the successful penetration of $116.20 will bolster the price up to $118.70, the previous high. The RSI is rising towards its 70 level, though with strong momentum while the MACD oscillator is rising above its trigger line, in the positive territory endorsing our bullish view.
This member did not declare if he had a position on this financial instrument or a related financial instrument.
About author

Offline


Add a comment
Comments
0 comments on the analysis APPLE INC. - Daily