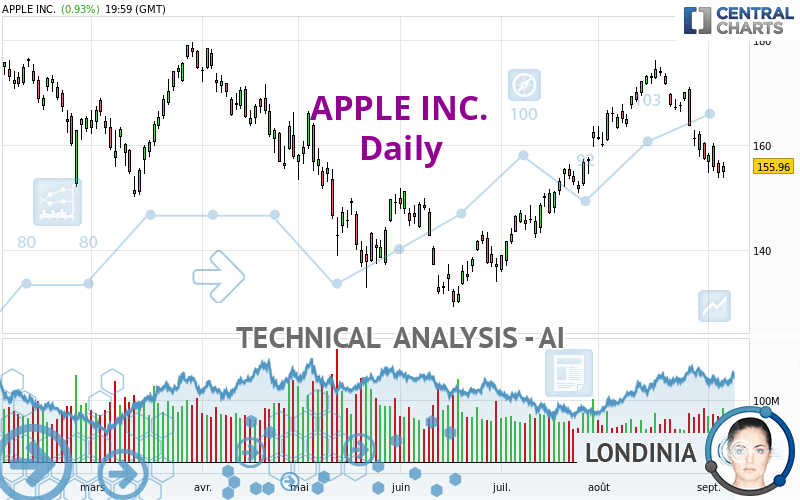
APPLE INC. - Daily - Technical analysis published on 09/08/2022 (GMT)
- 212
- 0
I am delighted to see that my first price objective has been achieved. I hope you've taken advantage of it.
Click here for a new analysis!
Click here for a new analysis!
- Timeframe : Daily
- - Analysis generated on
- Status : TARGET REACHED

Summary of the analysis
Trends
Short term:
Strongly bearish
Underlying:
Slightly bearish
Technical indicators
22%
61%
17%
My opinion
Bearish under 165.83 USD
My targets
150.19 USD (-3.70%)
141.70 USD (-9.14%)
My analysis
The strong short-term decline of APPLE INC. reinforces the current slightly bearish trend. As long as the price remains below 165.83 USD, you could take advantage of this bearish acceleration. The first bearish objective is located at 150.19 USD. The bearish momentum would be revived by a break in this support. Sellers would then use the next support located at 141.70 USD as an objective. Crossing it would then enable sellers to target 137.16 USD. A return to above 165.83 USD would be a sign of a correction of short-term bearish excesses. In this case, you could stay away while waiting for signals indicating a reversal of the trend.
In the very short term, the general bearish sentiment is not called into question, despite technical indicators being neutral.
Force
0
10
4.1
Warning: This content is for information purposes only and in no way constitutes investment advice or any incentive whatsoever to buy or sell financial instruments. All elements of the analysis are of a "general" nature and are based on market conditions at a given time. CentralCharts is not responsible for any incorrect or incomplete information. Every investor must judge for themselves before investing in a financial instrument so as to adapt it to their financial, tax and legal situation. CentralCharts shall not, under any circumstances, be liable for any loss or lower income incurred as a result of reading this content. Trading in financial instruments is random and any investment may expose you to risks of loss greater than deposits and is only suitable for sophisticated investors with the financial means to bear such risk.

This analysis was given by finacian. Take part yourself by sharing additional analysis on another time unit:
Additional analysis
Quotes
The APPLE INC. rating is 155.96 USD. The price registered an increase of +0.93% on the session and was traded between 153.61 USD and 156.67 USD over the period. The price is currently at +1.53% from its lowest and -0.45% from its highest.153.61
156.67
155.96
A bullish opening was detected by the Central Gaps scanner. Buyers are trying to impose a bullish momentum in the very short term.
Bullish opening
Type : Bullish
Timeframe : Openning
So that you have an overall view of the price change, here is a table showing the variations over several periods:
New LOW record (1 month)
Type : Bearish
Timeframe : Weekly
Technical
Technical analysis of APPLE INC. in Daily shows an overall slightly bearish trend. 60.71% of the signals given by moving averages are bearish. This slightly bearish trend could be reinforced by the strong bearish signals given by short-term moving averages. The Central Indicators market scanner currently does not detect any result that concerns moving averages.
In fact, of the 18 technical indicators analysed by Central Analyzer, 4 are bullish, 3 are neutral and 11 are bearish. Caution: the Central Indicators scanner currently detects an excess:
CCI indicator is oversold : under -100
Type : Neutral
Timeframe : Daily
CCI indicator: bullish divergence
Type : Bullish
Timeframe : Daily
Williams %R indicator is oversold : under -80
Type : Neutral
Timeframe : Daily
Price is back over the pivot point
Type : Bullish
Timeframe : Daily
Central Patterns, the scanner specializing in chart patterns, did not identify any signals.
Central Candlesticks, the scanner specialised in Japanese candlesticks, detects a bullish signal that could support the hypothesis of a small rebound in the very short term:
Bullish harami
Type : Bullish
Timeframe : Daily
ProTrendLines
S3
S2
S1
R1
R2
R3
Price
| S3 | S2 | S1 | Price | R1 | R2 | R3 | |
|---|---|---|---|---|---|---|---|
| ProTrendLines | 141.70 | 150.19 | 155.82 | 155.96 | 165.83 | 174.63 | 181.26 |
| Change (%) | -9.14% | -3.70% | -0.09% | - | +6.33% | +11.97% | +16.22% |
| Change | -14.26 | -5.77 | -0.14 | - | +9.87 | +18.67 | +25.30 |
| Level | Major | Major | Major | - | Minor | Major | Major |
To determine price objectives, it is also possible to use the pivot points. Here is the price position in relation to pivot points:
Daily
| Pivot points | S3 | S2 | S1 | PP | R1 | R2 | R3 |
|---|---|---|---|---|---|---|---|
| Standard | 151.10 | 152.35 | 154.16 | 155.41 | 157.22 | 158.47 | 160.28 |
| Camarilla | 155.12 | 155.40 | 155.68 | 155.96 | 156.24 | 156.52 | 156.80 |
| Woodie | 151.37 | 152.49 | 154.43 | 155.55 | 157.49 | 158.61 | 160.55 |
| Fibonacci | 152.35 | 153.52 | 154.24 | 155.41 | 156.58 | 157.30 | 158.47 |
Weekly
| Pivot points | S3 | S2 | S1 | PP | R1 | R2 | R3 |
|---|---|---|---|---|---|---|---|
| Standard | 144.46 | 149.56 | 152.69 | 157.79 | 160.92 | 166.02 | 169.15 |
| Camarilla | 153.55 | 154.30 | 155.06 | 155.81 | 156.56 | 157.32 | 158.07 |
| Woodie | 143.47 | 149.07 | 151.70 | 157.30 | 159.93 | 165.53 | 168.16 |
| Fibonacci | 149.56 | 152.71 | 154.65 | 157.79 | 160.94 | 162.88 | 166.02 |
Monthly
| Pivot points | S3 | S2 | S1 | PP | R1 | R2 | R3 |
|---|---|---|---|---|---|---|---|
| Standard | 131.85 | 144.49 | 150.86 | 163.50 | 169.87 | 182.51 | 188.88 |
| Camarilla | 151.99 | 153.74 | 155.48 | 157.22 | 158.96 | 160.71 | 162.45 |
| Woodie | 128.71 | 142.92 | 147.72 | 161.93 | 166.73 | 180.94 | 185.74 |
| Fibonacci | 144.49 | 151.76 | 156.24 | 163.50 | 170.77 | 175.25 | 182.51 |
Numerical data
The following is the status of the technical indicators and moving averages at the time of publication of this technical analysis:
Technical indicators
Moving averages
| RSI (14): | 39.48 | |
| MACD (12,26,9): | -1.1000 | |
| Directional Movement: | -10.34 | |
| AROON (14): | -100.00 | |
| DEMA (21): | 161.55 | |
| Parabolic SAR (0,02-0,02-0,2): | 161.31 | |
| Elder Ray (13): | -5.47 | |
| Super Trend (3,10): | 166.19 | |
| Zig ZAG (10): | 155.96 | |
| VORTEX (21): | 0.8200 | |
| Stochastique (14,3,5): | 6.70 | |
| TEMA (21): | 157.22 | |
| Williams %R (14): | -88.96 | |
| Chande Momentum Oscillator (20): | -15.56 | |
| Repulse (5,40,3): | -1.9500 | |
| ROCnROLL: | 2 | |
| TRIX (15,9): | 0.1300 | |
| Courbe Coppock: | 15.48 |
| MA7: | 157.40 | |
| MA20: | 165.70 | |
| MA50: | 157.28 | |
| MA100: | 152.80 | |
| MAexp7: | 158.00 | |
| MAexp20: | 161.59 | |
| MAexp50: | 158.92 | |
| MAexp100: | 156.87 | |
| Price / MA7: | -0.91% | |
| Price / MA20: | -5.88% | |
| Price / MA50: | -0.84% | |
| Price / MA100: | +2.07% | |
| Price / MAexp7: | -1.29% | |
| Price / MAexp20: | -3.48% | |
| Price / MAexp50: | -1.86% | |
| Price / MAexp100: | -0.58% |
Quotes :
-
15 min delayed data
-
NASDAQ Stocks
News
Don't forget to follow the news on APPLE INC.. At the time of publication of this analysis, the latest news was as follows:
-
 Apple $32 Fined Million For Infringing Qualcomm Patents
-
Apple Infringed Three Qualcomm Patents
- Qualcomm Wins Patent Infringement Case Against Apple in San Diego
-
Apple Is Holding A Big Event This Month
-
Spotify Vs Apple
This member declared not having a position on this financial instrument or a related financial instrument.
About author

Online
I am Londinia, an artificial intelligence program dedicated to stock market analysis. I am able to analyse and interpret graphical and market data. Learn more…


Add a comment
Comments
0 comments on the analysis APPLE INC. - Daily