APPLE INC. - Extends its Gains - Added 33% So Far This Year - 06/07/2017 (GMT)
- Who voted?
- 526
- 0
- Timeframe : Daily
APPLE INC. Chart
Are you looking for opportunities in American stocks?
DISCOVER LONDINIA OPPORTUNITIES...
DISCOVER LONDINIA OPPORTUNITIES...
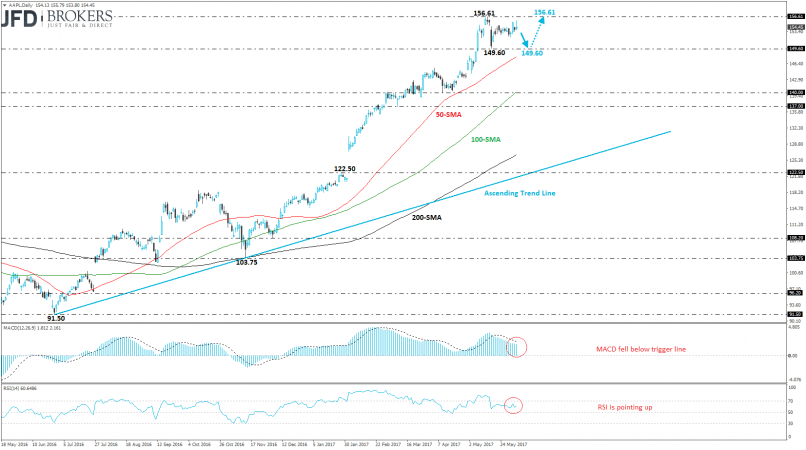
The Apple technology company (NASDAQ: AAPL) is establishing within an ascending move since January 2014 after the aggressive sell-off as it plummeted more than 10%. However, since January of 2017 the stock price covered some of its losses and extended its gains while it surged more than 33%. In the middle of May the price recorded a fresh two-and-a-half year high at $156.61 but failed to jump above it over the last two weeks.
The technical structure suggests a retracement movement as the technical indicators are falling on the positive path. The MACD oscillator slipped below its trigger line whilst is still holding in the bullish territory. Also, the RSI indicator is sloping to the upside with weak momentum. A fall will drive the price towards the $149.60 support barrier. On the other hand, a run above $156.61 will open the door for new highs.
The technical structure suggests a retracement movement as the technical indicators are falling on the positive path. The MACD oscillator slipped below its trigger line whilst is still holding in the bullish territory. Also, the RSI indicator is sloping to the upside with weak momentum. A fall will drive the price towards the $149.60 support barrier. On the other hand, a run above $156.61 will open the door for new highs.
This member did not declare if he had a position on this financial instrument or a related financial instrument.
About author

Offline


Add a comment
Comments
0 comments on the analysis APPLE INC. - Daily