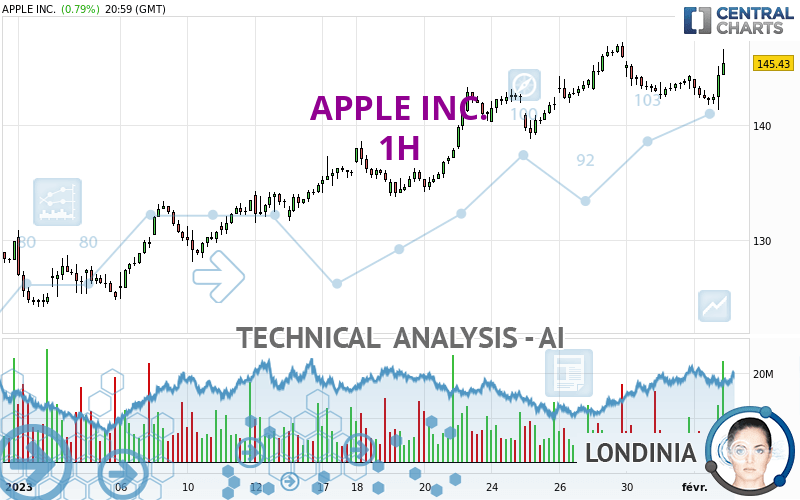
APPLE INC. - 1H - Technical analysis published on 02/02/2023 (GMT)
- Who voted?
- 141
- 0
Click here for a new analysis!
- Timeframe : 1H
- - Analysis generated on
- Status : TARGET REACHED

Summary of the analysis

Additional analysis
Quotes
The APPLE INC. rating is 145.43 USD. The price has increased by +0.79% since the last closing and was traded between 141.32 USD and 146.61 USD over the period. The price is currently at +2.91% from its lowest and -0.80% from its highest.A study of price movements over other periods shows the following variations:
Near a new HIGH record (1st january)
Type : Bullish
Timeframe : Weekly
Near a new HIGH record (1 month)
Type : Bullish
Timeframe : Weekly
Technical
Technical analysis of this 1H chart of APPLE INC. indicates that the overall trend is strongly bullish. The signals given by the moving averages are 92.86% bullish. This strong bullish trend is confirmed by the strong signals currently being given by short-term moving averages. The Central Indicators market scanner is currently detecting several bearish and bullish signals that could impact this trend:
Bullish trend reversal : adaptative moving average 20
Type : Bullish
Timeframe : 1 hour
Moving Average bearish crossovers : AMA20 & AMA50
Type : Bearish
Timeframe : 1 hour
The probability of a further increase is high given the direction of the technical indicators.
But beware of excesses. The Central Indicators scanner currently detects this:
CCI indicator is overbought : over 100
Type : Neutral
Timeframe : 1 hour
Pivot points : price is over resistance 1
Type : Neutral
Timeframe : 1 hour
MACD crosses UP its Moving Average
Type : Bullish
Timeframe : 1 hour
SuperTrend indicator bullish reversal
Type : Bullish
Timeframe : 1 hour
MACD indicator is back over 0
Type : Bullish
Timeframe : 1 hour
The Central Patterns scanner, which studies chart patterns, resistances and supports, has identified this signal:
Near resistance of channel
Type : Bearish
Timeframe : 1 hour
The Central Candlesticks scanner, specialised in Japanese candlesticks, did not identify any signals.
| S3 | S2 | S1 | Price | R1 | R2 | R3 | |
|---|---|---|---|---|---|---|---|
| ProTrendLines | 133.59 | 138.00 | 142.28 | 145.43 | 147.23 | 155.53 | 163.11 |
| Change (%) | -8.14% | -5.11% | -2.17% | - | +1.24% | +6.94% | +12.16% |
| Change | -11.84 | -7.43 | -3.15 | - | +1.80 | +10.10 | +17.68 |
| Level | Minor | Major | Intermediate | - | Intermediate | Intermediate | Minor |
To determine price objectives, it is also possible to use the pivot points. Here is the price position in relation to pivot points:
| Pivot points | S3 | S2 | S1 | PP | R1 | R2 | R3 |
|---|---|---|---|---|---|---|---|
| Standard | 137.01 | 139.16 | 142.30 | 144.45 | 147.59 | 149.74 | 152.88 |
| Camarilla | 143.98 | 144.46 | 144.95 | 145.43 | 145.92 | 146.40 | 146.89 |
| Woodie | 137.50 | 139.41 | 142.79 | 144.70 | 148.08 | 149.99 | 153.37 |
| Fibonacci | 139.16 | 141.18 | 142.43 | 144.45 | 146.47 | 147.72 | 149.74 |
| Pivot points | S3 | S2 | S1 | PP | R1 | R2 | R3 |
|---|---|---|---|---|---|---|---|
| Standard | 130.81 | 134.36 | 140.14 | 143.69 | 149.47 | 153.02 | 158.80 |
| Camarilla | 143.36 | 144.22 | 145.08 | 145.93 | 146.79 | 147.64 | 148.50 |
| Woodie | 131.94 | 134.92 | 141.27 | 144.25 | 150.60 | 153.58 | 159.93 |
| Fibonacci | 134.36 | 137.92 | 140.12 | 143.69 | 147.25 | 149.45 | 153.02 |
| Pivot points | S3 | S2 | S1 | PP | R1 | R2 | R3 |
|---|---|---|---|---|---|---|---|
| Standard | 106.84 | 115.50 | 129.90 | 138.56 | 152.96 | 161.62 | 176.02 |
| Camarilla | 137.95 | 140.06 | 142.18 | 144.29 | 146.40 | 148.52 | 150.63 |
| Woodie | 109.70 | 116.94 | 132.76 | 140.00 | 155.82 | 163.06 | 178.88 |
| Fibonacci | 115.50 | 124.31 | 129.75 | 138.56 | 147.37 | 152.81 | 161.62 |
Numerical data
The following are the details of the technical indicators and moving averages that were collected to generate this technical analysis:
| RSI (14): | 63.57 | |
| MACD (12,26,9): | 0.1400 | |
| Directional Movement: | 15.59 | |
| AROON (14): | 7.14 | |
| DEMA (21): | 143.77 | |
| Parabolic SAR (0,02-0,02-0,2): | 141.32 | |
| Elder Ray (13): | 1.90 | |
| Super Trend (3,10): | 141.39 | |
| Zig ZAG (10): | 145.43 | |
| VORTEX (21): | 0.9300 | |
| Stochastique (14,3,5): | 61.80 | |
| TEMA (21): | 143.34 | |
| Williams %R (14): | -22.31 | |
| Chande Momentum Oscillator (20): | 2.27 | |
| Repulse (5,40,3): | 1.7400 | |
| ROCnROLL: | 1 | |
| TRIX (15,9): | 0.0100 | |
| Courbe Coppock: | 0.08 |
| MA7: | 143.86 | |
| MA20: | 136.80 | |
| MA50: | 138.77 | |
| MA100: | 142.89 | |
| MAexp7: | 143.73 | |
| MAexp20: | 143.54 | |
| MAexp50: | 142.45 | |
| MAexp100: | 140.08 | |
| Price / MA7: | +1.09% | |
| Price / MA20: | +6.31% | |
| Price / MA50: | +4.80% | |
| Price / MA100: | +1.78% | |
| Price / MAexp7: | +1.18% | |
| Price / MAexp20: | +1.32% | |
| Price / MAexp50: | +2.09% | |
| Price / MAexp100: | +3.82% |
News
The latest news and videos published on APPLE INC. at the time of the analysis were as follows:
-
 Apple $32 Fined Million For Infringing Qualcomm Patents
-
Apple Infringed Three Qualcomm Patents
- Qualcomm Wins Patent Infringement Case Against Apple in San Diego
-
Apple Is Holding A Big Event This Month
-
Spotify Vs Apple
About author

Online


Add a comment
Comments
0 comments on the analysis APPLE INC. - 1H