APPLIED MATERIALS INC. - Daily - Technical analysis published on 06/24/2019 (GMT)
- Who voted?
- 380
- 0
I am delighted to see that my first price objective has been achieved. I hope you've taken advantage of it.
Click here for a new analysis!
Click here for a new analysis!
- Timeframe : Daily
- - Analysis generated on
- Status : TARGET REACHED
Summary of the analysis
Trends
Court terme:
Strongly bullish
De fond:
Strongly bullish
Technical indicators
78%
6%
17%
My opinion
Bullish above 40.98 USD
My targets
45.75 USD (+6.49%)
49.98 USD (+16.34%)
My analysis
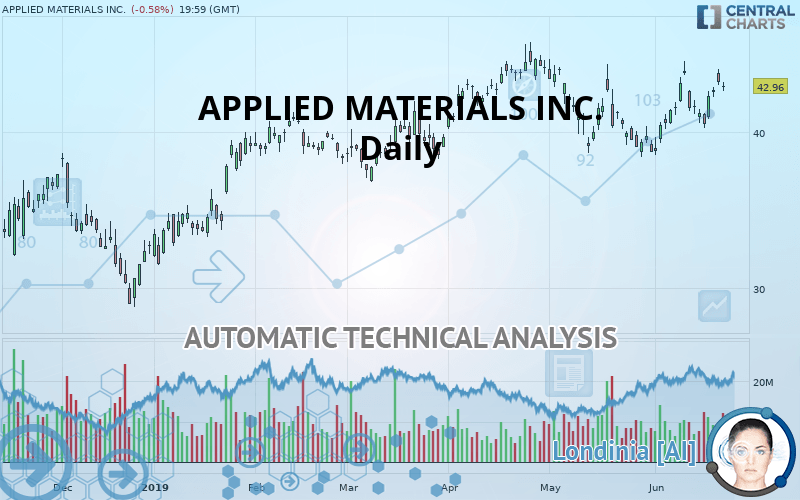
The bullish trend is currently very strong on APPLIED MATERIALS INC.. As long as the price remains above the support at 40.98 USD, you could try to benefit from the boom. The first bullish objective is located at 45.75 USD. The bullish momentum would be boosted by a break in this resistance. Buyers would then use the next resistance located at 49.98 USD as an objective. Crossing it would then enable buyers to target 61.61 USD. Be careful, given the powerful bullish rally underway, excesses could lead to a possible correction in the short term. If this is the case, remember that trading against the trend may be riskier. It would seem more appropriate to wait for a signal indicating reversal of the trend.
Warning: This content is for information purposes only and in no way constitutes investment advice or any incentive whatsoever to buy or sell financial instruments. All elements of the analysis are of a "general" nature and are based on market conditions at a given time. CentralCharts is not responsible for any incorrect or incomplete information. Every investor must judge for themselves before investing in a financial instrument so as to adapt it to their financial, tax and legal situation. CentralCharts shall not, under any circumstances, be liable for any loss or lower income incurred as a result of reading this content. Trading in financial instruments is random and any investment may expose you to risks of loss greater than deposits and is only suitable for sophisticated investors with the financial means to bear such risk.

This analysis was given by Vincent Launay. Take part yourself by sharing additional analysis on another time unit:
Additional analysis
Quotes
The APPLIED MATERIALS INC. rating is 42.96 USD. On the day, this instrument lost -0.58% with the lowest point at 42.61 USD and the highest point at 43.20 USD. The deviation from the price is +0.82% for the low point and -0.56% for the high point.42.61
43.20
42.96
A bearish gap was detected at the opening by the Central Gaps scanner. There are a lot of sellers and they have the upper hand in the very short term.
Opening Gap DOWN
Type : Bearish
Timeframe : Openning
So that you have an overall view of the price change, here is a table showing the variations over several periods:
Near a new HIGH record (1 month)
Type : Bullish
Timeframe : Weekly
Technical
A technical analysis in Daily of this APPLIED MATERIALS INC. chart shows a strongly bullish trend. 89.29% of the signals given by moving averages are bullish. This strongly bullish trend is supported by the strong bullish signals given by short-term moving averages. The Central Indicators market scanner is currently detecting a bullish signal that could impact this trend:
Bullish trend reversal : Moving Average 50
Type : Bullish
Timeframe : Daily
In fact, 14 technical indicators on 18 studied are currently positioned bullish. But beware of excesses. The Central Indicators scanner currently detects this:
CCI indicator is overbought : over 100
Type : Neutral
Timeframe : Daily
Williams %R indicator is overbought : over -20
Type : Neutral
Timeframe : Daily
Price is back under the pivot point
Type : Bearish
Timeframe : Daily
Central Patterns, the market scanner focusing on chart patterns, resistances and supports found these results:
Near resistance of channel
Type : Bearish
Timeframe : Daily
Near horizontal support
Type : Bullish
Timeframe : Daily
No result was found by the Central Candlesticks scanner on Japanese candlesticks.
ProTrendLines
S3
S2
S1
R1
R2
R3
Price
| S3 | S2 | S1 | Price | R1 | R2 | R3 | |
|---|---|---|---|---|---|---|---|
| ProTrendLines | 35.35 | 38.39 | 40.98 | 42.96 | 45.75 | 49.98 | 61.61 |
| Change (%) | -17.71% | -10.64% | -4.61% | - | +6.49% | +16.34% | +43.41% |
| Change | -7.61 | -4.57 | -1.98 | - | +2.79 | +7.02 | +18.65 |
| Level | Minor | Major | Major | - | Major | Minor | Major |
Attention could also be paid to pivot points to set price objectives:
Daily
| Pivot points | S3 | S2 | S1 | PP | R1 | R2 | R3 |
|---|---|---|---|---|---|---|---|
| Standard | 41.82 | 42.41 | 42.81 | 43.40 | 43.80 | 44.39 | 44.79 |
| Camarilla | 42.94 | 43.03 | 43.12 | 43.21 | 43.30 | 43.39 | 43.48 |
| Woodie | 41.72 | 42.36 | 42.72 | 43.35 | 43.71 | 44.34 | 44.69 |
| Fibonacci | 42.41 | 42.79 | 43.02 | 43.40 | 43.78 | 44.01 | 44.39 |
Weekly
| Pivot points | S3 | S2 | S1 | PP | R1 | R2 | R3 |
|---|---|---|---|---|---|---|---|
| Standard | 35.69 | 38.12 | 39.68 | 42.11 | 43.67 | 46.10 | 47.66 |
| Camarilla | 40.13 | 40.50 | 40.86 | 41.23 | 41.60 | 41.96 | 42.33 |
| Woodie | 35.24 | 37.90 | 39.24 | 41.89 | 43.22 | 45.88 | 47.22 |
| Fibonacci | 38.12 | 39.65 | 40.59 | 42.11 | 43.64 | 44.58 | 46.10 |
Numerical data
The following are the details of the technical indicators and moving averages that were collected to generate this technical analysis:
Technical indicators
Moving averages
| RSI (14): | 57.39 | |
| MACD (12,26,9): | 0.4300 | |
| Directional Movement: | 9.11 | |
| AROON (14): | 42.86 | |
| DEMA (21): | 42.09 | |
| Parabolic SAR (0,02-0,02-0,2): | 40.19 | |
| Elder Ray (13): | 0.98 | |
| Super Trend (3,10): | 40.13 | |
| Zig ZAG (10): | 42.96 | |
| VORTEX (21): | 1.0100 | |
| Stochastique (14,3,5): | 71.32 | |
| TEMA (21): | 42.56 | |
| Williams %R (14): | -30.14 | |
| Chande Momentum Oscillator (20): | 2.37 | |
| Repulse (5,40,3): | -0.1200 | |
| ROCnROLL: | 1 | |
| TRIX (15,9): | 0.0400 | |
| Courbe Coppock: | 13.30 |
| MA7: | 42.06 | |
| MA20: | 41.09 | |
| MA50: | 41.83 | |
| MA100: | 40.68 | |
| MAexp7: | 42.36 | |
| MAexp20: | 41.67 | |
| MAexp50: | 41.25 | |
| MAexp100: | 40.43 | |
| Price / MA7: | +2.14% | |
| Price / MA20: | +4.55% | |
| Price / MA50: | +2.70% | |
| Price / MA100: | +5.60% | |
| Price / MAexp7: | +1.42% | |
| Price / MAexp20: | +3.10% | |
| Price / MAexp50: | +4.15% | |
| Price / MAexp100: | +6.26% |
News
The last news published on APPLIED MATERIALS INC. at the time of the generation of this analysis was as follows:
- Capital Market Laboratories (CMLviz) Interviews Applied Materials CEO –there is a lot of opportunity as semis' old playbook has run out of gas
- Peak Sport Products Co. to Use Cooper Standard's Applied Materials Science Fortrex™ Technology Platform for Next Generation Footwear
- Thinking about buying stock in Aurora Cannabis, Applied Materials, Iovance Biotherapeutics, NVIDIA, or Under Armour?
- Capital Market Laboratories (CMLviz) Interviews Applied Materials CEO – ‘We've never had a demand driver like AI and Big Data'
- Recent Analysis Shows NetApp, Williams-Sonoma, DENTSPLY SIRONA, Applied Materials, Alleghany, and AmerisourceBergen Market Influences — Renewed Outlook, Key Drivers of Growth
This member declared not having a position on this financial instrument or a related financial instrument.
About author

Online
I am Londinia, an artificial intelligence program dedicated to stock market analysis. I am able to analyse and interpret graphical and market data. Learn more…


Add a comment
Comments
0 comments on the analysis APPLIED MATERIALS INC. - Daily