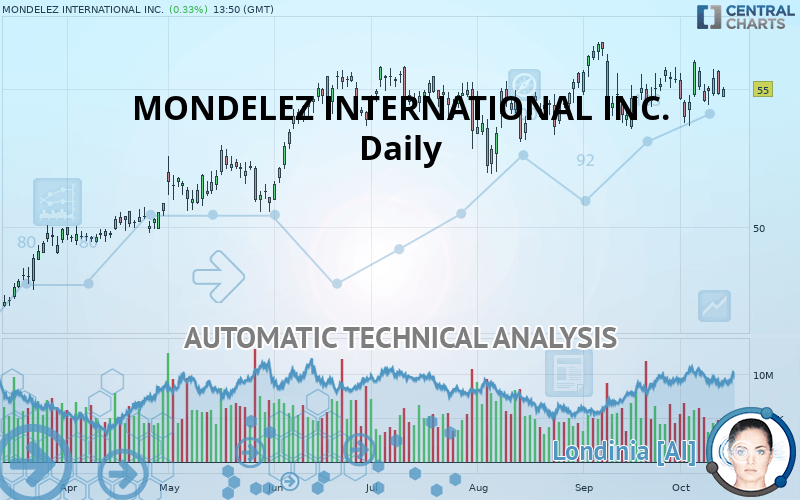
MONDELEZ INTERNATIONAL INC. - Daily - Technical analysis published on 10/14/2019 (GMT)
- Who voted?
- 345
- 0
Click here for a new analysis!
- Timeframe : Daily
- - Analysis generated on
- Status : INVALID

Summary of the analysis

Additional analysis
Quotes
The MONDELEZ INTERNATIONAL INC. rating is 55.00 USD. The price has increased by +0.33% since the last closing and was between 54.71 USD and 55.09 USD. This implies that the price is at +0.53% from its lowest and at -0.16% from its highest.The Central Gaps scanner detects a bearish opening. A small advantage for sellers in the very short term.
Bearish opening
Type : Bearish
Timeframe : Openning
A study of price movements over other periods shows the following variations:
Near a new HIGH record (5 years)
Type : Bullish
Timeframe : Weekly
Near a new HIGH record (1 year)
Type : Bullish
Timeframe : Weekly
Near a new HIGH record (1st january)
Type : Bullish
Timeframe : Weekly
Technical
Technical analysis of MONDELEZ INTERNATIONAL INC. in Daily shows a strongly overall bullish trend. The signals given by moving averages are 89.29% bullish. This strongly bullish trend seems to be running out of steam given the signals being given by short-term moving averages. The Central Indicators scanner does not detect any result on moving averages that would impact this trend.
In fact, according to the parameters integrated into the Central Analyzer system, only 7 technical indicators out of 18 analysed are currently bullish. But beware of excesses. The Central Indicators scanner currently detects this:
Williams %R indicator is overbought : over -20
Type : Neutral
Timeframe : Daily
MACD crosses DOWN its Moving Average
Type : Bearish
Timeframe : Daily
Price is back over the pivot point
Type : Bullish
Timeframe : Daily
Momentum indicator is back under 0
Type : Bearish
Timeframe : Daily
Williams %R indicator is back under -50
Type : Bearish
Timeframe : Daily
Central Patterns, the market scanner focusing on chart patterns, resistances and supports found this result:
Near support of channel
Type : Bullish
Timeframe : Daily
From the Japanese candlestick perspective, the Central Candlesticks scanner notes the presence of these results that could impact the short-term trend:
Bullish engulfing lines
Type : Bullish
Timeframe : Daily
Bearish engulfing lines
Type : Bearish
Timeframe : Daily
| S3 | S2 | S1 | Price | R1 | |
|---|---|---|---|---|---|
| ProTrendLines | 49.97 | 52.22 | 53.98 | 55.00 | 56.63 |
| Change (%) | -9.15% | -5.05% | -1.85% | - | +2.96% |
| Change | -5.03 | -2.78 | -1.02 | - | +1.63 |
| Level | Minor | Intermediate | Major | - | Major |
Pivot points can also be used to set your price objectives. Here is the price situation in relation to pivot points:
| Pivot points | S3 | S2 | S1 | PP | R1 | R2 | R3 |
|---|---|---|---|---|---|---|---|
| Standard | 53.90 | 54.34 | 54.87 | 55.31 | 55.84 | 55.99 | 56.30 |
| Camarilla | 55.14 | 55.23 | 55.32 | 55.41 | 55.50 | 55.59 | 55.68 |
| Woodie | 53.49 | 54.36 | 54.93 | 55.33 | 55.90 | 56.30 | 56.87 |
| Fibonacci | 54.21 | 54.55 | 54.76 | 55.10 | 55.44 | 55.65 | 55.99 |
| Pivot points | S3 | S2 | S1 | PP | R1 | R2 | R3 |
|---|---|---|---|---|---|---|---|
| Standard | 52.04 | 52.86 | 54.42 | 55.24 | 56.80 | 56.41 | 57.00 |
| Camarilla | 55.33 | 55.54 | 55.76 | 55.98 | 56.20 | 56.42 | 56.63 |
| Woodie | 52.74 | 53.05 | 54.79 | 55.43 | 57.17 | 57.81 | 59.55 |
| Fibonacci | 53.63 | 54.16 | 54.49 | 55.02 | 55.55 | 55.88 | 56.41 |
| Pivot points | S3 | S2 | S1 | PP | R1 | R2 | R3 |
|---|---|---|---|---|---|---|---|
| Standard | 50.47 | 51.88 | 53.60 | 55.01 | 56.73 | 58.15 | 59.87 |
| Camarilla | 54.46 | 54.75 | 55.03 | 55.32 | 55.61 | 55.89 | 56.18 |
| Woodie | 50.62 | 51.96 | 53.75 | 55.09 | 56.89 | 58.22 | 60.02 |
| Fibonacci | 51.88 | 53.08 | 53.82 | 55.01 | 56.21 | 56.95 | 58.15 |
Numerical data
The following is the status of technical indicators and moving averages registered at the time this technical analysis was created:
| RSI (14): | 50.15 | |
| MACD (12,26,9): | 0.1300 | |
| Directional Movement: | 6.75 | |
| AROON (14): | 7.15 | |
| DEMA (21): | 55.04 | |
| Parabolic SAR (0,02-0,02-0,2): | 53.86 | |
| Elder Ray (13): | 0.32 | |
| Super Trend (3,10): | 56.40 | |
| Zig ZAG (10): | 54.87 | |
| VORTEX (21): | 1.0400 | |
| Stochastique (14,3,5): | 58.12 | |
| TEMA (21): | 55.02 | |
| Williams %R (14): | -49.79 | |
| Chande Momentum Oscillator (20): | -0.57 | |
| Repulse (5,40,3): | -0.9200 | |
| ROCnROLL: | -1 | |
| TRIX (15,9): | 0.0300 | |
| Courbe Coppock: | 1.22 |
| MA7: | 55.10 | |
| MA20: | 54.85 | |
| MA50: | 54.50 | |
| MA100: | 54.09 | |
| MAexp7: | 54.98 | |
| MAexp20: | 54.86 | |
| MAexp50: | 54.54 | |
| MAexp100: | 53.51 | |
| Price / MA7: | -0.18% | |
| Price / MA20: | +0.27% | |
| Price / MA50: | +0.92% | |
| Price / MA100: | +1.68% | |
| Price / MAexp7: | +0.04% | |
| Price / MAexp20: | +0.26% | |
| Price / MAexp50: | +0.84% | |
| Price / MAexp100: | +2.78% |
News
The last news published on MONDELEZ INTERNATIONAL INC. at the time of the generation of this analysis was as follows:
- Post Consumer Brands and Mondelēz International Introduce Sour Patch Kids® Flavored Cereal
-
 Mondelez Recalls Some Ritz Cracker Products
- TM Capital advises longtime client, Tate's Bake Shop, a portfolio company of The Riverside Company, in its sale to Mondelēz International, Inc. for approximately $500 million
- #MyOreoCreation Contest Finalist Flavor Submissions Hit Shelves Nationwide For Fans To Try And Vote On
- Mondelez International, Inc. Class A to Host Earnings Call
About author

Online


Add a comment
Comments
0 comments on the analysis MONDELEZ INTERNATIONAL INC. - Daily