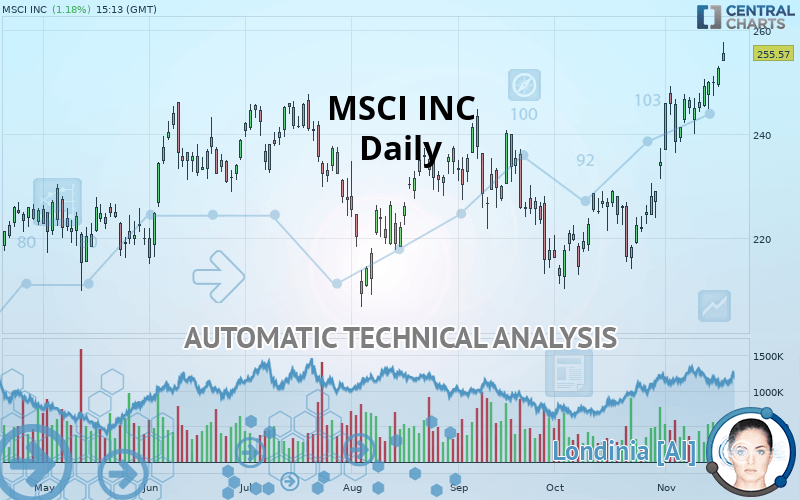
MSCI INC. - Daily - Technical analysis published on 11/19/2019 (GMT)
- Who voted?
- 151
- 0
Click here for a new analysis!
- Timeframe : Daily
- - Analysis generated on
- Status : LEVEL MAINTAINED

Summary of the analysis

Additional analysis
Quotes
The MSCI INC rating is 255.57 USD. On the day, this instrument gained +1.18% and was between 253.96 USD and 257.62 USD. This implies that the price is at +0.63% from its lowest and at -0.80% from its highest.The Central Gaps scanner detects the formation of a bullish gap marking the strong presence of buyers against sellers at the opening. This formed a quotation gap.
Opening Gap UP
Type : Bullish
Timeframe : Openning
Here is a more detailed summary of the historical variations registered by MSCI INC:
New HIGH record (5 years)
Type : Bullish
Timeframe : Weekly
New HIGH record (1 year)
Type : Bullish
Timeframe : Weekly
New HIGH record (1st january)
Type : Bullish
Timeframe : Weekly
New HIGH record (1 month)
Type : Bullish
Timeframe : Weekly
Technical
A technical analysis in Daily of this MSCI INC chart shows a strongly bullish trend. 89.29% of the signals given by moving averages are bullish. This strongly bullish trend is supported by the strong bullish signals given by short-term moving averages. There is no crossing of moving average by the price or crossing of moving averages between themselves.
In fact, 16 technical indicators on 18 studied are currently bullish. But beware of excesses. The Central Indicators scanner currently detects this:
RSI indicator is overbought : over 70
Type : Neutral
Timeframe : Daily
Williams %R indicator is overbought : over -20
Type : Neutral
Timeframe : Daily
Pivot points : price is over resistance 1
Type : Neutral
Timeframe : Weekly
Pivot points : price is over resistance 2
Type : Neutral
Timeframe : Daily
An analysis of the price chart with the Central Patterns scanner (detector of chart patterns and resistances and supports) shows a result that can have an impact on the price change:
Resistance of channel is broken
Type : Bullish
Timeframe : Daily
Central Candlesticks, the scanner specialised in Japanese candlesticks, detects a bullish signal that could support the hypothesis of a small rebound in the very short term:
Bullish engulfing lines
Type : Bullish
Timeframe : Daily
| S3 | S2 | S1 | Price | |
|---|---|---|---|---|
| ProTrendLines | 216.34 | 229.43 | 241.27 | 255.57 |
| Change (%) | -15.35% | -10.23% | -5.60% | - |
| Change | -39.23 | -26.14 | -14.30 | - |
| Level | Intermediate | Intermediate | Major | - |
To determine price objectives, it is also possible to use the pivot points. Here is the price position in relation to pivot points:
| Pivot points | S3 | S2 | S1 | PP | R1 | R2 | R3 |
|---|---|---|---|---|---|---|---|
| Standard | 246.03 | 247.50 | 250.05 | 251.52 | 254.07 | 255.54 | 258.09 |
| Camarilla | 251.48 | 251.85 | 252.22 | 252.59 | 252.96 | 253.33 | 253.70 |
| Woodie | 246.56 | 247.77 | 250.58 | 251.79 | 254.60 | 255.81 | 258.62 |
| Fibonacci | 247.50 | 249.04 | 249.99 | 251.52 | 253.06 | 254.01 | 255.54 |
| Pivot points | S3 | S2 | S1 | PP | R1 | R2 | R3 |
|---|---|---|---|---|---|---|---|
| Standard | 231.44 | 235.42 | 242.36 | 246.34 | 253.28 | 257.26 | 264.20 |
| Camarilla | 246.31 | 247.31 | 248.31 | 249.31 | 250.31 | 251.31 | 252.31 |
| Woodie | 232.93 | 236.16 | 243.85 | 247.08 | 254.77 | 258.00 | 265.69 |
| Fibonacci | 235.42 | 239.59 | 242.17 | 246.34 | 250.51 | 253.09 | 257.26 |
| Pivot points | S3 | S2 | S1 | PP | R1 | R2 | R3 |
|---|---|---|---|---|---|---|---|
| Standard | 189.95 | 199.85 | 216.88 | 226.79 | 243.82 | 253.72 | 270.75 |
| Camarilla | 226.50 | 228.97 | 231.44 | 233.91 | 236.38 | 238.85 | 241.32 |
| Woodie | 193.51 | 201.63 | 220.44 | 228.57 | 247.38 | 255.50 | 274.31 |
| Fibonacci | 199.85 | 210.14 | 216.50 | 226.79 | 237.08 | 243.43 | 253.72 |
Numerical data
The following are the details of the technical indicators and moving averages that were collected to generate this technical analysis:
| RSI (14): | 73.18 | |
| MACD (12,26,9): | 7.3100 | |
| Directional Movement: | 21.30 | |
| AROON (14): | 100.00 | |
| DEMA (21): | 250.60 | |
| Parabolic SAR (0,02-0,02-0,2): | 239.66 | |
| Elder Ray (13): | 10.01 | |
| Super Trend (3,10): | 239.78 | |
| Zig ZAG (10): | 256.76 | |
| VORTEX (21): | 1.2000 | |
| Stochastique (14,3,5): | 97.28 | |
| TEMA (21): | 255.37 | |
| Williams %R (14): | -2.30 | |
| Chande Momentum Oscillator (20): | 11.45 | |
| Repulse (5,40,3): | 3.7300 | |
| ROCnROLL: | 1 | |
| TRIX (15,9): | 0.3700 | |
| Courbe Coppock: | 19.13 |
| MA7: | 249.68 | |
| MA20: | 239.13 | |
| MA50: | 229.96 | |
| MA100: | 230.78 | |
| MAexp7: | 250.26 | |
| MAexp20: | 241.79 | |
| MAexp50: | 234.17 | |
| MAexp100: | 228.81 | |
| Price / MA7: | +2.36% | |
| Price / MA20: | +6.87% | |
| Price / MA50: | +11.14% | |
| Price / MA100: | +10.74% | |
| Price / MAexp7: | +2.12% | |
| Price / MAexp20: | +5.70% | |
| Price / MAexp50: | +9.14% | |
| Price / MAexp100: | +11.70% |
News
The latest news and videos published on MSCI INC at the time of the analysis were as follows:
About author

Online


Add a comment
Comments
0 comments on the analysis MSCI INC. - Daily