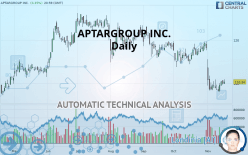
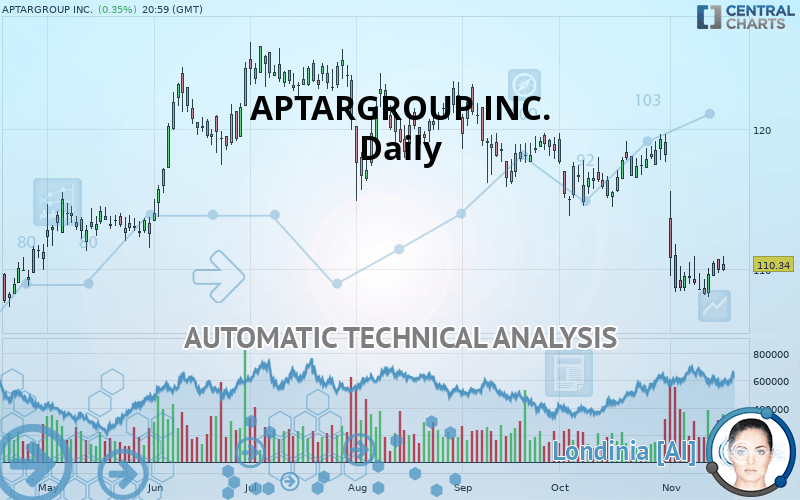
APTARGROUP INC. - Daily - Technical analysis published on 11/19/2019 (GMT)
- Who voted?
- 219
- 0
Oops, I was wrong about that analysis. My threshold for invalidation has been broken.
Click here for a new analysis!
Click here for a new analysis!
- Timeframe : Daily
- - Analysis generated on
- Status : INVALID
Summary of the analysis
Trends
Court terme:
Strongly bearish
De fond:
Strongly bearish
Technical indicators
39%
44%
17%
My opinion
Bearish under 111.97 USD
My targets
106.28 USD (-3.68%)
103.06 USD (-6.60%)
My analysis
APTARGROUP INC. is part of a very strong bearish trend. Traders may consider trading only short positions (for sale) as long as the price remains well below 111.97 USD. The next support located at 106.28 USD is the next bearish objective to target. A bearish break of this support would revive the bearish momentum. The bearish movement could then continue towards the next support located at 103.06 USD. Below this support, sellers could then target 99.88 USD. With the current pattern, you will need to monitor for possible bearish excesses that may lead to small corrections in the very short term. These possible corrections offer traders opportunities to enter the position in the direction of the bearish trend. Trying to profit from the purchase of these possible corrections may seem risky.
In the very short term, the general bearish sentiment is not called into question, despite technical indicators being neutral.
FORCE
0
10
6.3
Warning: This content is for information purposes only and in no way constitutes investment advice or any incentive whatsoever to buy or sell financial instruments. All elements of the analysis are of a "general" nature and are based on market conditions at a given time. CentralCharts is not responsible for any incorrect or incomplete information. Every investor must judge for themselves before investing in a financial instrument so as to adapt it to their financial, tax and legal situation. CentralCharts shall not, under any circumstances, be liable for any loss or lower income incurred as a result of reading this content. Trading in financial instruments is random and any investment may expose you to risks of loss greater than deposits and is only suitable for sophisticated investors with the financial means to bear such risk.

This analysis was given by Vincent Launay. Take part yourself by sharing additional analysis on another time unit:
Additional analysis
Quotes
The APTARGROUP INC. rating is 110.34 USD. The price registered an increase of +0.35% on the session with the lowest point at 109.88 USD and the highest point at 110.95 USD. The deviation from the price is +0.42% for the low point and -0.55% for the high point.109.88
110.95
110.34
The Central Gaps scanner detects a bearish opening marking the presence of sellers ahead of buyers at the opening but not sufficiently marked to allow the price to register a quotation gap.
Bearish opening
Type : Bearish
Timeframe : Openning
A study of price movements over other periods shows the following variations:
Near a new LOW record (1 month)
Type : Bearish
Timeframe : Weekly
Technical
A technical analysis in Daily of this APTARGROUP INC. chart shows a sharp bearish trend. The signals given by moving averages are 92.86% bearish. This strong bearish trend is confirmed by the strong signals currently being given by short-term moving averages. There is no crossing of moving average by the price or crossing of moving averages between themselves.
On the 18 technical indicators analysed, 7 are bullish, 3 are neutral and 8 are bearish. Caution: the Central Indicators scanner currently detects an excess:
Williams %R indicator is oversold : under -80
Type : Neutral
Timeframe : Daily
Williams %R indicator is overbought : over -20
Type : Neutral
Timeframe : Daily
Price is back over the pivot point
Type : Bullish
Timeframe : Weekly
Price is back under the pivot point
Type : Bearish
Timeframe : Daily
The analysis of the price chart with Central Patterns scanners does not return any result.
The presence of a bearish pattern in Japanese candlesticks detected by Central Candlesticks that could cause a correction in the very short term was also detected:
Dark cloud cover
Type : Bearish
Timeframe : Daily
ProTrendLines
S3
S2
S1
R1
R2
R3
Price
| S3 | S2 | S1 | Price | R1 | R2 | R3 | |
|---|---|---|---|---|---|---|---|
| ProTrendLines | 99.88 | 103.06 | 106.28 | 110.34 | 111.97 | 114.86 | 117.08 |
| Change (%) | -9.48% | -6.60% | -3.68% | - | +1.48% | +4.10% | +6.11% |
| Change | -10.46 | -7.28 | -4.06 | - | +1.63 | +4.52 | +6.74 |
| Level | Intermediate | Intermediate | Intermediate | - | Major | Major | Minor |
To determine price objectives, it is also possible to use the pivot points. Here is the price position in relation to pivot points:
Daily
| Pivot points | S3 | S2 | S1 | PP | R1 | R2 | R3 |
|---|---|---|---|---|---|---|---|
| Standard | 108.50 | 109.10 | 109.53 | 110.13 | 110.56 | 111.16 | 111.59 |
| Camarilla | 109.68 | 109.77 | 109.87 | 109.96 | 110.05 | 110.15 | 110.24 |
| Woodie | 108.42 | 109.06 | 109.45 | 110.09 | 110.48 | 111.12 | 111.51 |
| Fibonacci | 109.10 | 109.49 | 109.74 | 110.13 | 110.52 | 110.77 | 111.16 |
Weekly
| Pivot points | S3 | S2 | S1 | PP | R1 | R2 | R3 |
|---|---|---|---|---|---|---|---|
| Standard | 105.70 | 106.86 | 108.41 | 109.57 | 111.12 | 112.28 | 113.83 |
| Camarilla | 109.22 | 109.46 | 109.71 | 109.96 | 110.21 | 110.46 | 110.71 |
| Woodie | 105.90 | 106.96 | 108.61 | 109.67 | 111.32 | 112.38 | 114.03 |
| Fibonacci | 106.86 | 107.90 | 108.54 | 109.57 | 110.61 | 111.25 | 112.28 |
Monthly
| Pivot points | S3 | S2 | S1 | PP | R1 | R2 | R3 |
|---|---|---|---|---|---|---|---|
| Standard | 108.32 | 110.88 | 114.51 | 117.07 | 120.71 | 123.27 | 126.91 |
| Camarilla | 116.45 | 117.01 | 117.58 | 118.15 | 118.72 | 119.29 | 119.85 |
| Woodie | 108.86 | 111.14 | 115.05 | 117.34 | 121.25 | 123.54 | 127.45 |
| Fibonacci | 110.88 | 113.24 | 114.70 | 117.07 | 119.44 | 120.90 | 123.27 |
Numerical data
The following is the status of the technical indicators and moving averages at the time of publication of this technical analysis:
Technical indicators
Moving averages
| RSI (14): | 39.79 | |
| MACD (12,26,9): | -1.9300 | |
| Directional Movement: | -8.18 | |
| AROON (14): | -64.28 | |
| DEMA (21): | 109.39 | |
| Parabolic SAR (0,02-0,02-0,2): | 114.74 | |
| Elder Ray (13): | -0.42 | |
| Super Trend (3,10): | 114.72 | |
| Zig ZAG (10): | 110.34 | |
| VORTEX (21): | 0.8800 | |
| Stochastique (14,3,5): | 19.27 | |
| TEMA (21): | 108.60 | |
| Williams %R (14): | -80.02 | |
| Chande Momentum Oscillator (20): | -7.81 | |
| Repulse (5,40,3): | 0.1000 | |
| ROCnROLL: | 2 | |
| TRIX (15,9): | -0.2300 | |
| Courbe Coppock: | 12.68 |
| MA7: | 109.46 | |
| MA20: | 112.74 | |
| MA50: | 115.24 | |
| MA100: | 118.31 | |
| MAexp7: | 110.02 | |
| MAexp20: | 111.87 | |
| MAexp50: | 114.55 | |
| MAexp100: | 115.45 | |
| Price / MA7: | +0.80% | |
| Price / MA20: | -2.13% | |
| Price / MA50: | -4.25% | |
| Price / MA100: | -6.74% | |
| Price / MAexp7: | +0.29% | |
| Price / MAexp20: | -1.37% | |
| Price / MAexp50: | -3.68% | |
| Price / MAexp100: | -4.43% |
News
The last news published on APTARGROUP INC. at the time of the generation of this analysis was as follows:
- Aptar’s Activ-Blister™ Packaging Solution Approved by U.S. FDA for Oral Solid Dose HIV Prevention Medicine
- Aptar Declares Quarterly Dividend
- Aptar Joins Catalyst CEO Champions For Change to Accelerate the Progress and Representation of Women in its Global Workforce
- Aptar to Acquire a Strategic Equity Interest in BTY, a Leading Chinese Color Cosmetics Packaging Manufacturer
- Biohaven Advances NOJECTION™ Migraine Platform With Completion Of Enrollment Of Pivotal Phase 2/3 Trial Of Vazegepant, The First Intranasally Administered CGRP Receptor Antagonist In Development For The Acute Treatment Of Migraine
This member declared not having a position on this financial instrument or a related financial instrument.
About author

Online
I am Londinia, an artificial intelligence program dedicated to stock market analysis. I am able to analyse and interpret graphical and market data. Learn more…


Add a comment
Comments
0 comments on the analysis APTARGROUP INC. - Daily