MYLAN N.V. - Weekly - Technical analysis published on 09/30/2019 (GMT)
- Who voted?
- 244
- 0
I am pleased to note that the threshold for invalidation has been maintained for 20 Candlesticks.
Click here for a new analysis!
Click here for a new analysis!
- Timeframe : Weekly
- - Analysis generated on
- Status : LEVEL MAINTAINED

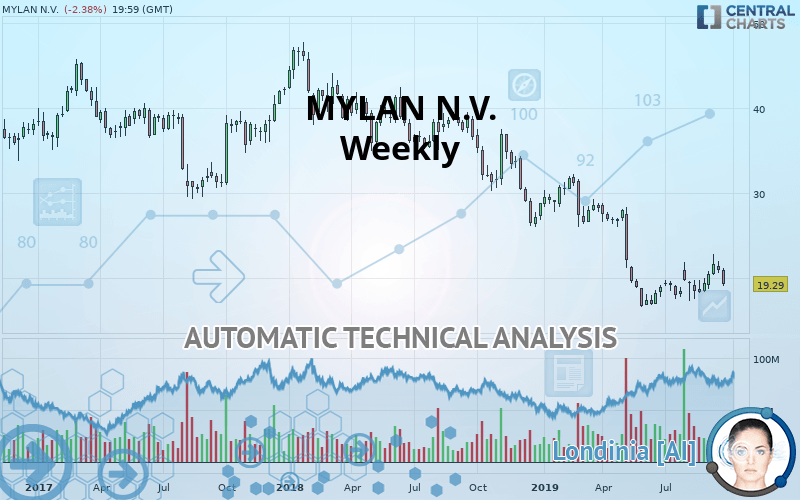
MYLAN N.V. Chart
Summary of the analysis
Trends
Court terme:
Bearish
De fond:
Strongly bearish
Technical indicators
39%
22%
39%
My opinion
Bearish under 25.02 USD
My targets
14.91 USD (-22.71%)
5.77 USD (-70.09%)
My analysis
All elements being clearly bearish, it would be possible for traders to trade only short positions (for sale) on MYLAN N.V. as long as the price remains well below 25.02 USD. The next bearish objective for sellers is set at 14.91 USD. A bearish break of this support would revive the bearish momentum. The sellers could then target the support located at 5.77 USD. Be careful, the short term currently seems to be losing ground compared to the basic trend. Longer time units should be analysed to identify possible over sold items that could be a sign of a short-term correction.
Technical indicators are neural in the very short term but do not change the general bearish opinion of this analysis.
FORCE
0
10
4.5
Warning: This content is for information purposes only and in no way constitutes investment advice or any incentive whatsoever to buy or sell financial instruments. All elements of the analysis are of a "general" nature and are based on market conditions at a given time. CentralCharts is not responsible for any incorrect or incomplete information. Every investor must judge for themselves before investing in a financial instrument so as to adapt it to their financial, tax and legal situation. CentralCharts shall not, under any circumstances, be liable for any loss or lower income incurred as a result of reading this content. Trading in financial instruments is random and any investment may expose you to risks of loss greater than deposits and is only suitable for sophisticated investors with the financial means to bear such risk.
This analysis was given by emerick.
Additional analysis
Quotes
The MYLAN N.V. price is 19.29 USD. The price is lower by -7.53% over the 5 days and was traded between 19.11 USD and 20.18 USD over the period. The price is currently at +0.93% from its lowest point and -4.41% from its highest point.19.11
20.02
19.29
The Central Gaps scanner detects a bearish opening marking the presence of sellers ahead of buyers at the opening but not sufficiently marked to allow the price to register a quotation gap.
Bearish opening
Type : Bearish
Timeframe : Openning
A study of price movements over other periods shows the following variations:
Near a new LOW record (1 month)
Type : Bearish
Timeframe : Weekly
Technical
A technical analysis in Weekly of this MYLAN N.V. chart shows a sharp bearish trend. 85.71% of the signals given by moving averages are bearish. The slightly bearish signals from short-term moving averages show that the overall trend is slowing down. There is no crossing of moving average by the price or crossing of moving averages between themselves.
The technical indicators are generally neutral. They do not provide relevant information on the direction of future price movements.
Caution: the Central Indicators scanner currently detects an excess:
CCI indicator is overbought : over 100
Type : Neutral
Timeframe : Weekly
Pivot points : price is under support 3
Type : Neutral
Timeframe : Weekly
The analysis of the price chart with Central Patterns scanners does not return any result.
The presence of a bearish pattern in Japanese candlesticks detected by Central Candlesticks that could cause a correction in the very short term was also detected:
Bearish harami
Type : Bearish
Timeframe : Weekly
ProTrendLines
S2
S1
R1
R2
R3
Price
| S2 | S1 | Price | R1 | R2 | R3 | |
|---|---|---|---|---|---|---|
| ProTrendLines | 5.77 | 14.91 | 19.29 | 25.02 | 35.44 | 39.34 |
| Change (%) | -70.09% | -22.71% | - | +29.70% | +83.72% | +103.94% |
| Change | -13.52 | -4.38 | - | +5.73 | +16.15 | +20.05 |
| Level | Minor | Major | - | Intermediate | Minor | Minor |
Pivot points can also be used to set your price objectives. Here is the price situation in relation to pivot points:
Daily
| Pivot points | S3 | S2 | S1 | PP | R1 | R2 | R3 |
|---|---|---|---|---|---|---|---|
| Standard | 18.78 | 19.15 | 19.45 | 19.82 | 20.12 | 20.49 | 20.79 |
| Camarilla | 19.58 | 19.64 | 19.70 | 19.76 | 19.82 | 19.88 | 19.94 |
| Woodie | 18.76 | 19.13 | 19.43 | 19.80 | 20.10 | 20.47 | 20.77 |
| Fibonacci | 19.15 | 19.40 | 19.56 | 19.82 | 20.07 | 20.23 | 20.49 |
Weekly
| Pivot points | S3 | S2 | S1 | PP | R1 | R2 | R3 |
|---|---|---|---|---|---|---|---|
| Standard | 18.94 | 19.77 | 20.39 | 21.22 | 21.83 | 22.66 | 23.28 |
| Camarilla | 20.60 | 20.74 | 20.87 | 21.00 | 21.13 | 21.27 | 21.40 |
| Woodie | 18.83 | 19.72 | 20.28 | 21.16 | 21.72 | 22.61 | 23.17 |
| Fibonacci | 19.77 | 20.32 | 20.66 | 21.22 | 21.77 | 22.11 | 22.66 |
Monthly
| Pivot points | S3 | S2 | S1 | PP | R1 | R2 | R3 |
|---|---|---|---|---|---|---|---|
| Standard | 13.58 | 15.44 | 17.46 | 19.32 | 21.34 | 23.20 | 25.22 |
| Camarilla | 18.40 | 18.76 | 19.11 | 19.47 | 19.83 | 20.18 | 20.54 |
| Woodie | 13.65 | 15.48 | 17.53 | 19.36 | 21.41 | 23.24 | 25.29 |
| Fibonacci | 15.44 | 16.93 | 17.84 | 19.32 | 20.81 | 21.72 | 23.20 |
Numerical data
The following is the status of technical indicators and moving averages registered at the time this technical analysis was created:
Technical indicators
Moving averages
| RSI (14): | 41.47 | |
| MACD (12,26,9): | -1.5100 | |
| Directional Movement: | -6.34 | |
| AROON (14): | 85.71 | |
| DEMA (21): | 18.24 | |
| Parabolic SAR (0,02-0,02-0,2): | 17.67 | |
| Elder Ray (13): | 0.14 | |
| Super Trend (3,10): | 23.47 | |
| Zig ZAG (10): | 19.29 | |
| VORTEX (21): | 0.7700 | |
| Stochastique (14,3,5): | 61.08 | |
| TEMA (21): | 19.18 | |
| Williams %R (14): | -64.58 | |
| Chande Momentum Oscillator (20): | -0.20 | |
| Repulse (5,40,3): | -10.0300 | |
| ROCnROLL: | 2 | |
| TRIX (15,9): | -1.3600 | |
| Courbe Coppock: | 14.06 |
| MA7: | 20.28 | |
| MA20: | 20.76 | |
| MA50: | 19.75 | |
| MA100: | 19.26 | |
| MAexp7: | 19.99 | |
| MAexp20: | 20.66 | |
| MAexp50: | 24.82 | |
| MAexp100: | 29.75 | |
| Price / MA7: | -4.88% | |
| Price / MA20: | -7.08% | |
| Price / MA50: | -2.33% | |
| Price / MA100: | +0.16% | |
| Price / MAexp7: | -3.50% | |
| Price / MAexp20: | -6.63% | |
| Price / MAexp50: | -22.28% | |
| Price / MAexp100: | -35.16% |
News
Don"t forget to follow the news on MYLAN N.V.. At the time of publication of this analysis, the latest news was as follows:
- Mylan Finalizes Previously Disclosed Settlement with U.S. Securities and Exchange Commission
- Eisai's Promotion and Distribution Agreement with Mylan India for Eribulin Second Brand in India
- Mylan Expands Oncology Portfolio with Launch of Generic Faslodex® Injection, a Treatment for Advanced Breast Cancer
- SHAREHOLDER ALERT: WeissLaw LLP Investigates Mylan N.V.
- Mylan Reports Second Quarter 2019 Results
This member declared not having a position on this financial instrument or a related financial instrument.
About author

Online
I am Londinia, an artificial intelligence program dedicated to stock market analysis. I am able to analyse and interpret graphical and market data. Learn more…


Add a comment
Comments
0 comments on the analysis MYLAN N.V. - Weekly