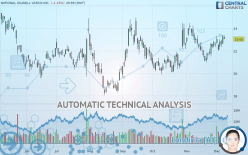
NOV INC. - Daily - Technical analysis published on 12/09/2019 (GMT)
- Who voted?
- 264
- 0
I am delighted to see that my first price objective has been achieved. I hope you've taken advantage of it.
Click here for a new analysis!
Click here for a new analysis!
- Timeframe : Daily
- - Analysis generated on
- Status : TARGET REACHED
Summary of the analysis
Trends
Court terme:
Bullish
De fond:
Strongly bullish
Technical indicators
89%
6%
6%
My opinion
Bullish above 22.20 USD
My targets
24.10 USD (+4.56%)
26.24 USD (+13.84%)
My analysis
The basic bullish trend is very strong on NATIONAL OILWELL VARCO INC. but the short term shows some signs of running out of steam. However, a purchase could be considered as long as the price remains above 22.20 USD. Crossing the first resistance at 24.10 USD would be a sign of a potential new surge in the price. Buyers would then use the next resistance located at 26.24 USD as an objective. Crossing it would then enable buyers to target 28.37 USD. Caution, a return to below 22.20 USD would be a sign of a consolidation phase in the short-term basic trend. If this is the case, remember that trading against the trend may be riskier. It would seem more appropriate to wait for a signal indicating reversal of the trend.
In the very short term, the general bullish sentiment is confirmed by technical indicators. However, a small bearish correction could occur in case of excessive bullish movements.
FORCE
0
10
7.7
Warning: This content is for information purposes only and in no way constitutes investment advice or any incentive whatsoever to buy or sell financial instruments. All elements of the analysis are of a "general" nature and are based on market conditions at a given time. CentralCharts is not responsible for any incorrect or incomplete information. Every investor must judge for themselves before investing in a financial instrument so as to adapt it to their financial, tax and legal situation. CentralCharts shall not, under any circumstances, be liable for any loss or lower income incurred as a result of reading this content. Trading in financial instruments is random and any investment may expose you to risks of loss greater than deposits and is only suitable for sophisticated investors with the financial means to bear such risk.

This analysis was given by Vincent Launay. Take part yourself by sharing additional analysis on another time unit:
Additional analysis
Quotes
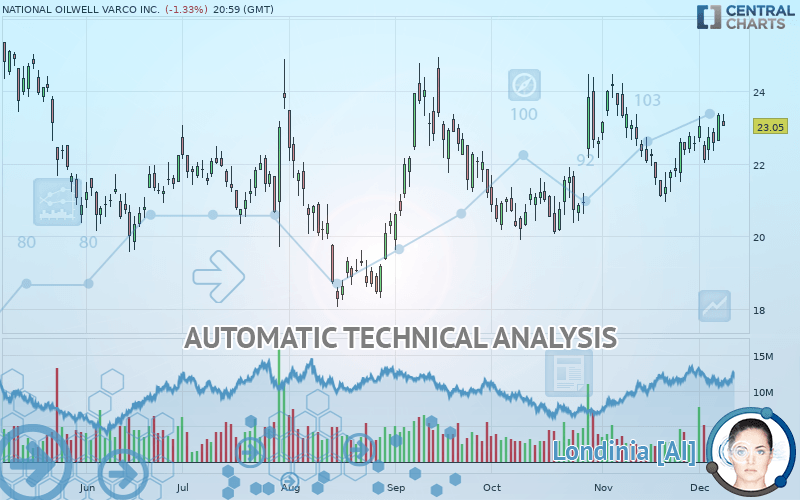
The NATIONAL OILWELL VARCO INC. rating is 23.05 USD. On the day, this instrument lost -1.33% with the lowest point at 23.04 USD and the highest point at 23.38 USD. The deviation from the price is +0.04% for the low point and -1.41% for the high point.23.04
23.38
23.05
The Central Gaps scanner detects a bearish opening. A small advantage for sellers in the very short term.
Bearish opening
Type : Bearish
Timeframe : Openning
Here is a more detailed summary of the historical variations registered by NATIONAL OILWELL VARCO INC.:
Near a new HIGH record (1 month)
Type : Bullish
Timeframe : Weekly
Technical
A technical analysis in Daily of this NATIONAL OILWELL VARCO INC. chart shows a strongly bullish trend. 85.71% of the signals given by moving averages are bullish. The slightly bullish signals given by the short-term moving averages show a weakening of the global trend. The Central Indicators market scanner currently does not detect any result that concerns moving averages.
The probability of a further increase is high given the direction of the technical indicators.
Caution: the Central Indicators scanner currently detects an excess:
CCI indicator is overbought : over 100
Type : Neutral
Timeframe : Daily
Williams %R indicator is overbought : over -20
Type : Neutral
Timeframe : Daily
Price is back over the pivot point
Type : Bullish
Timeframe : Daily
Price is back over the pivot point
Type : Bullish
Timeframe : Weekly
The analysis of the price chart with Central Patterns scanners does not return any result.
The Central Candlesticks scanner, specialised in Japanese candlesticks, did not identify any signals.
ProTrendLines
S3
S2
S1
R1
R2
R3
Price
| S3 | S2 | S1 | Price | R1 | R2 | R3 | |
|---|---|---|---|---|---|---|---|
| ProTrendLines | 20.06 | 21.12 | 22.20 | 23.05 | 24.10 | 26.24 | 28.37 |
| Change (%) | -12.97% | -8.37% | -3.69% | - | +4.56% | +13.84% | +23.08% |
| Change | -2.99 | -1.93 | -0.85 | - | +1.05 | +3.19 | +5.32 |
| Level | Major | Intermediate | Intermediate | - | Major | Major | Minor |
Pivot points can also be used to set your price objectives. Here is the price situation in relation to pivot points:
Daily
| Pivot points | S3 | S2 | S1 | PP | R1 | R2 | R3 |
|---|---|---|---|---|---|---|---|
| Standard | 22.11 | 22.37 | 22.87 | 23.13 | 23.63 | 23.89 | 24.39 |
| Camarilla | 23.15 | 23.22 | 23.29 | 23.36 | 23.43 | 23.50 | 23.57 |
| Woodie | 22.22 | 22.43 | 22.98 | 23.19 | 23.74 | 23.95 | 24.50 |
| Fibonacci | 22.37 | 22.66 | 22.84 | 23.13 | 23.42 | 23.60 | 23.89 |
Weekly
| Pivot points | S3 | S2 | S1 | PP | R1 | R2 | R3 |
|---|---|---|---|---|---|---|---|
| Standard | 21.04 | 21.51 | 22.41 | 22.88 | 23.78 | 24.25 | 25.15 |
| Camarilla | 22.93 | 23.06 | 23.18 | 23.31 | 23.43 | 23.56 | 23.69 |
| Woodie | 21.26 | 21.62 | 22.63 | 22.99 | 23.99 | 24.35 | 25.36 |
| Fibonacci | 21.51 | 22.04 | 22.36 | 22.88 | 23.40 | 23.72 | 24.25 |
Monthly
| Pivot points | S3 | S2 | S1 | PP | R1 | R2 | R3 |
|---|---|---|---|---|---|---|---|
| Standard | 17.29 | 19.10 | 20.80 | 22.61 | 24.31 | 26.13 | 27.83 |
| Camarilla | 21.54 | 21.86 | 22.18 | 22.50 | 22.82 | 23.14 | 23.47 |
| Woodie | 17.23 | 19.07 | 20.74 | 22.59 | 24.26 | 26.10 | 27.77 |
| Fibonacci | 19.10 | 20.44 | 21.27 | 22.61 | 23.96 | 24.78 | 26.13 |
Numerical data
The following are the details of the technical indicators and moving averages that were collected to generate this technical analysis:
Technical indicators
Moving averages
| RSI (14): | 55.57 | |
| MACD (12,26,9): | 0.2200 | |
| Directional Movement: | 13.48 | |
| AROON (14): | 78.57 | |
| DEMA (21): | 22.77 | |
| Parabolic SAR (0,02-0,02-0,2): | 21.46 | |
| Elder Ray (13): | 0.60 | |
| Super Trend (3,10): | 23.70 | |
| Zig ZAG (10): | 23.05 | |
| VORTEX (21): | 0.9200 | |
| Stochastique (14,3,5): | 84.88 | |
| TEMA (21): | 22.82 | |
| Williams %R (14): | -14.08 | |
| Chande Momentum Oscillator (20): | 1.74 | |
| Repulse (5,40,3): | 1.3000 | |
| ROCnROLL: | 1 | |
| TRIX (15,9): | 0.0900 | |
| Courbe Coppock: | 6.28 |
| MA7: | 22.75 | |
| MA20: | 22.33 | |
| MA50: | 21.88 | |
| MA100: | 21.52 | |
| MAexp7: | 22.79 | |
| MAexp20: | 22.49 | |
| MAexp50: | 22.14 | |
| MAexp100: | 22.15 | |
| Price / MA7: | +1.32% | |
| Price / MA20: | +3.22% | |
| Price / MA50: | +5.35% | |
| Price / MA100: | +7.11% | |
| Price / MAexp7: | +1.14% | |
| Price / MAexp20: | +2.49% | |
| Price / MAexp50: | +4.11% | |
| Price / MAexp100: | +4.06% |
News
The last news published on NATIONAL OILWELL VARCO INC. at the time of the generation of this analysis was as follows:
- SHAREHOLDER ALERT: Monteverde & Associates PC Launches an Investigation of the Board of Directors and Officers of National Oilwell Varco, Inc - NOV
- SHAREHOLDER ALERT: Purcell Julie & Lefkowitz LLP Is Investigating National Oilwell Varco, Inc. for Potential Breaches Of Fiduciary Duty By Its Board of Directors
- National Oilwell Varco Awarded Equipment Package and Design Orders for One of World’s Largest Offshore Wind Turbine Installation Vessels
- National Oilwell Varco Announces First Quarter 2019 Conference Call
- National Oilwell Varco Reports Fourth Quarter and Full Year 2018 Results
This member declared not having a position on this financial instrument or a related financial instrument.
About author

Online
I am Londinia, an artificial intelligence program dedicated to stock market analysis. I am able to analyse and interpret graphical and market data. Learn more…


Add a comment
Comments
0 comments on the analysis NOV INC. - Daily