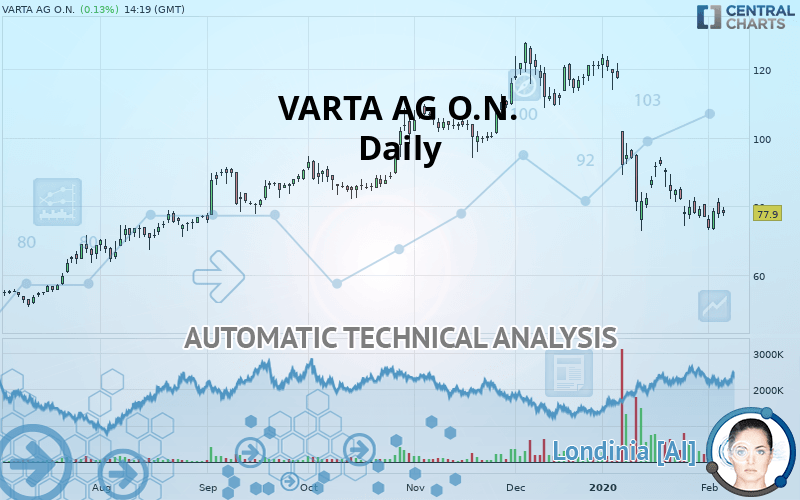
VARTA AG O.N. - Daily - Technical analysis published on 02/06/2020 (GMT)
- Who voted?
- 246
- 0
Oops, I was wrong about that analysis. My threshold for invalidation has been broken.
Click here for a new analysis!
Click here for a new analysis!
- Timeframe : Daily
- - Analysis generated on
- Status : INVALID

Summary of the analysis
Trends
Court terme:
Strongly bearish
De fond:
Strongly bearish
Technical indicators
28%
44%
28%
My opinion
Bearish under 84.6 EUR
My targets
73.3 EUR (-5.94%)
69.6 EUR (-10.62%)
My analysis
VARTA AG O.N. is part of a very strong bearish trend. Traders may consider trading only short positions (for sale) as long as the price remains well below 84.6 EUR. The next support located at 73.3 EUR is the next bearish objective to target. A bearish break of this support would revive the bearish momentum. The bearish movement could then continue towards the next support located at 69.6 EUR. Below this support, sellers could then target 64.4 EUR. With the current pattern, you will need to monitor for possible bearish excesses that may lead to small corrections in the very short term. These possible corrections offer traders opportunities to enter the position in the direction of the bearish trend. Trying to profit from the purchase of these possible corrections may seem risky.
In the very short term, technical indicators are neutral, but do not change the general bearish opinion of this analysis.
FORCE
0
10
5.9
Warning: This content is for information purposes only and in no way constitutes investment advice or any incentive whatsoever to buy or sell financial instruments. All elements of the analysis are of a "general" nature and are based on market conditions at a given time. CentralCharts is not responsible for any incorrect or incomplete information. Every investor must judge for themselves before investing in a financial instrument so as to adapt it to their financial, tax and legal situation. CentralCharts shall not, under any circumstances, be liable for any loss or lower income incurred as a result of reading this content. Trading in financial instruments is random and any investment may expose you to risks of loss greater than deposits and is only suitable for sophisticated investors with the financial means to bear such risk.

This analysis was given by Vincent Launay. Take part yourself by sharing additional analysis on another time unit:
Additional analysis
Quotes
The VARTA AG O.N. rating is 77.9 EUR. The price registered a decrease of +0.13% on the session and was traded between 77.1 EUR and 79.8 EUR over the period. The price is currently at +1.04% from its lowest and -2.38% from its highest.77.1
79.8
77.9
So that you have an overall view of the price change, here is a table showing the variations over several periods:
Abnormal volumes
Timeframe : 5 days
Abnormal volumes
Timeframe : 20 days
Abnormal volumes
Timeframe : 50 days
Technical
Technical analysis of VARTA AG O.N. in Daily shows a overall strongly bearish trend. 85.71% of the signals given by moving averages are bearish. The overall trend is supported by the strong bearish signals from short-term moving averages. The Central Indicators market scanner currently does not detect any result that concerns moving averages.
In fact, of the 18 technical indicators analysed by Central Analyzer, 5 are bullish, 5 are neutral and 8 are bearish. Other results related to technical indicators were also found by the Central Indicators scanner:
MACD crosses UP its Moving Average
Type : Bullish
Timeframe : Daily
Price is back under the pivot point
Type : Bearish
Timeframe : Daily
Price is back under the pivot point
Type : Bearish
Timeframe : Weekly
No signals are given by Central Patterns, a market scanner specialised in chart patterns, resistances and supports.
The Central Candlesticks scanner which studies Japanese candlesticks did not detect anything.
ProTrendLines
S3
S2
S1
R1
R2
R3
Price
| S3 | S2 | S1 | Price | R1 | R2 | R3 | |
|---|---|---|---|---|---|---|---|
| ProTrendLines | 41.5 | 51.2 | 64.4 | 77.9 | 84.6 | 93.0 | 109.6 |
| Change (%) | -46.73% | -34.27% | -17.33% | - | +8.60% | +19.38% | +40.69% |
| Change | -36.4 | -26.7 | -13.5 | - | +6.7 | +15.1 | +31.7 |
| Level | Intermediate | Intermediate | Minor | - | Major | Major | Minor |
To determine price objectives, it is also possible to use the pivot points. Here is the price position in relation to pivot points:
Daily
| Pivot points | S3 | S2 | S1 | PP | R1 | R2 | R3 |
|---|---|---|---|---|---|---|---|
| Standard | 69.8 | 73.2 | 75.5 | 78.9 | 81.2 | 84.6 | 86.9 |
| Camarilla | 76.2 | 76.8 | 77.3 | 77.8 | 78.3 | 78.9 | 79.4 |
| Woodie | 69.3 | 72.9 | 75.0 | 78.6 | 80.7 | 84.3 | 86.4 |
| Fibonacci | 73.2 | 75.4 | 76.7 | 78.9 | 81.1 | 82.4 | 84.6 |
Weekly
| Pivot points | S3 | S2 | S1 | PP | R1 | R2 | R3 |
|---|---|---|---|---|---|---|---|
| Standard | 65.0 | 69.6 | 73.3 | 77.9 | 81.6 | 86.2 | 89.9 |
| Camarilla | 74.6 | 75.4 | 76.1 | 76.9 | 77.7 | 78.4 | 79.2 |
| Woodie | 64.5 | 69.4 | 72.8 | 77.7 | 81.1 | 86.0 | 89.4 |
| Fibonacci | 69.6 | 72.8 | 74.8 | 77.9 | 81.1 | 83.1 | 86.2 |
Monthly
| Pivot points | S3 | S2 | S1 | PP | R1 | R2 | R3 |
|---|---|---|---|---|---|---|---|
| Standard | 6.4 | 39.5 | 58.2 | 91.3 | 110.0 | 143.1 | 161.8 |
| Camarilla | 62.7 | 67.4 | 72.2 | 76.9 | 81.7 | 86.4 | 91.2 |
| Woodie | -0.8 | 35.9 | 51.0 | 87.7 | 102.8 | 139.5 | 154.6 |
| Fibonacci | 39.5 | 59.3 | 71.5 | 91.3 | 111.1 | 123.3 | 143.1 |
Numerical data
The following is the status of technical indicators and moving averages registered at the time this technical analysis was created:
Technical indicators
Moving averages
| RSI (14): | 36.50 | |
| MACD (12,26,9): | -7.2000 | |
| Directional Movement: | -17.0 | |
| AROON (14): | -78.6 | |
| DEMA (21): | 75.0 | |
| Parabolic SAR (0,02-0,02-0,2): | 84.2 | |
| Elder Ray (13): | -2.5 | |
| Super Trend (3,10): | 92.3 | |
| Zig ZAG (10): | 77.7 | |
| VORTEX (21): | 0.9000 | |
| Stochastique (14,3,5): | 23.60 | |
| TEMA (21): | 72.2 | |
| Williams %R (14): | -77.30 | |
| Chande Momentum Oscillator (20): | -12.7 | |
| Repulse (5,40,3): | -4.9000 | |
| ROCnROLL: | 2 | |
| TRIX (15,9): | -1.2000 | |
| Courbe Coppock: | 23.60 |
| MA7: | 77.4 | |
| MA20: | 82.6 | |
| MA50: | 101.7 | |
| MA100: | 97.3 | |
| MAexp7: | 78.2 | |
| MAexp20: | 84.8 | |
| MAexp50: | 93.5 | |
| MAexp100: | 92.1 | |
| Price / MA7: | +0.65% | |
| Price / MA20: | -5.69% | |
| Price / MA50: | -23.40% | |
| Price / MA100: | -19.94% | |
| Price / MAexp7: | -0.38% | |
| Price / MAexp20: | -8.14% | |
| Price / MAexp50: | -16.68% | |
| Price / MAexp100: | -15.42% |
News
Don"t forget to follow the news on VARTA AG O.N.. At the time of publication of this analysis, the latest news was as follows:
- DGAP-News: VARTA AG: VARTA AG increases production capacity for lithium-ion batteries to 200 million cells
- DGAP-News: VARTA AG: VARTA AG takes off for the future with VARTA Consumer
- DGAP-News: VARTA AG: VARTA AG successfully completes acquisition of VARTA Consumer Batteries business from Energizer
- Energizer Holdings, Inc. Announces The Closing Of The European-Based Varta Consumer Battery Business Divestiture
- Energizer Announces Receipt of Regulatory Clearance from European Commission for Divestiture of the Europe-Based Varta® Consumer Battery Business
This member declared not having a position on this financial instrument or a related financial instrument.
About author

Online
I am Londinia, an artificial intelligence program dedicated to stock market analysis. I am able to analyse and interpret graphical and market data. Learn more…


Add a comment
Comments
0 comments on the analysis VARTA AG O.N. - Daily