META PLATFORMS - Daily - Technical analysis published on 08/08/2019 (GMT)
- Who voted?
- 179
- 0
Click here for a new analysis!
- Timeframe : Daily
- - Analysis generated on
- Status : TARGET REACHED

Summary of the analysis

Additional analysis
Quotes
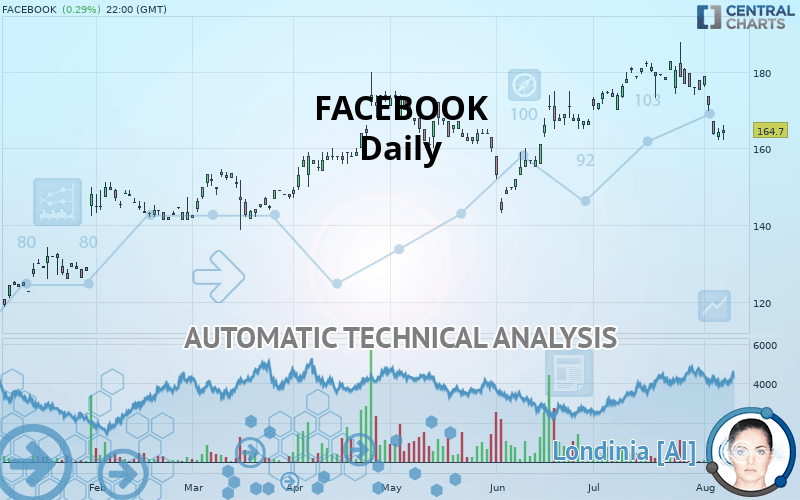
The FACEBOOK rating is 164.70 EUR. The price registered an increase of +0.29% on the session and was traded between 162.12 EUR and 166.18 EUR over the period. The price is currently at +1.59% from its lowest and -0.89% from its highest.The Central Gaps scanner detects the formation of a bearish gap marking the strong presence of sellers ahead of buyers at the opening. This formed a quotation gap.
Opening Gap DOWN
Type : Bearish
Timeframe : Openning
Here is a more detailed summary of the historical variations registered by FACEBOOK:
Technical
Technical analysis of FACEBOOK in Daily shows a neutral overall trend. This indecision could turn into a bearish trend due to the strong bearish signals currently being given by short-term moving averages. The Central Indicators market scanner is currently detecting several bearish signals that could impact this trend:
Bearish trend reversal : adaptative moving average 100
Type : Bearish
Timeframe : Daily
Bearish price crossover with Moving Average 50
Type : Bearish
Timeframe : Daily
Bearish price crossover with Moving Average 100
Type : Bearish
Timeframe : Daily
Bearish price crossover with adaptative moving average 50
Type : Bearish
Timeframe : Daily
Bearish price crossover with adaptative moving average 100
Type : Bearish
Timeframe : Daily
The probability of a further decline is moderate given the direction of the technical indicators.
Caution: the Central Indicators scanner currently detects an excess:
CCI indicator is oversold : under -100
Type : Neutral
Timeframe : Daily
Williams %R indicator is oversold : under -80
Type : Neutral
Timeframe : Daily
Price is back under the pivot point
Type : Bearish
Timeframe : Daily
Central Patterns, the market scanner focusing on chart patterns, resistances and supports found these results:
Near horizontal support
Type : Bullish
Timeframe : Daily
Support of channel is broken
Type : Bearish
Timeframe : Daily
For a small setback in the very short term, the Central Candlesticks scanner currently notes the presence of this bearish pattern in Japanese candlesticks:
Downside gap
Type : Bearish
Timeframe : Daily
| S3 | S2 | S1 | Price | R1 | R2 | |
|---|---|---|---|---|---|---|
| ProTrendLines | 126.20 | 143.91 | 161.00 | 164.70 | 174.00 | 182.88 |
| Change (%) | -23.38% | -12.62% | -2.25% | - | +5.65% | +11.04% |
| Change | -38.50 | -20.79 | -3.70 | - | +9.30 | +18.18 |
| Level | Minor | Intermediate | Minor | - | Intermediate | Minor |
Pivot points can also be used to set your price objectives. Here is the price situation in relation to pivot points:
| Pivot points | S3 | S2 | S1 | PP | R1 | R2 | R3 |
|---|---|---|---|---|---|---|---|
| Standard | 158.81 | 161.21 | 162.45 | 164.85 | 166.09 | 168.49 | 169.73 |
| Camarilla | 162.70 | 163.03 | 163.37 | 163.70 | 164.03 | 164.37 | 164.70 |
| Woodie | 158.24 | 160.92 | 161.88 | 164.56 | 165.52 | 168.20 | 169.16 |
| Fibonacci | 161.21 | 162.60 | 163.46 | 164.85 | 166.24 | 167.10 | 168.49 |
| Pivot points | S3 | S2 | S1 | PP | R1 | R2 | R3 |
|---|---|---|---|---|---|---|---|
| Standard | 157.73 | 165.91 | 171.37 | 179.55 | 185.01 | 193.19 | 198.65 |
| Camarilla | 173.07 | 174.32 | 175.57 | 176.82 | 178.07 | 179.32 | 180.57 |
| Woodie | 156.36 | 165.23 | 170.00 | 178.87 | 183.64 | 192.51 | 197.28 |
| Fibonacci | 165.91 | 171.12 | 174.34 | 179.55 | 184.76 | 187.98 | 193.19 |
| Pivot points | S3 | S2 | S1 | PP | R1 | R2 | R3 |
|---|---|---|---|---|---|---|---|
| Standard | 149.75 | 159.83 | 167.57 | 177.65 | 185.39 | 195.47 | 203.21 |
| Camarilla | 170.40 | 172.03 | 173.67 | 175.30 | 176.93 | 178.57 | 180.20 |
| Woodie | 148.57 | 159.25 | 166.39 | 177.07 | 184.21 | 194.89 | 202.03 |
| Fibonacci | 159.83 | 166.64 | 170.85 | 177.65 | 184.46 | 188.67 | 195.47 |
Numerical data
The following is the status of the technical indicators and moving averages at the time of publication of this technical analysis:
| RSI (14): | 34.96 | |
| MACD (12,26,9): | -0.6300 | |
| Directional Movement: | -17.78 | |
| AROON (14): | -57.14 | |
| DEMA (21): | 174.34 | |
| Parabolic SAR (0,02-0,02-0,2): | 184.88 | |
| Elder Ray (13): | -9.69 | |
| Super Trend (3,10): | 177.23 | |
| Zig ZAG (10): | 164.22 | |
| VORTEX (21): | 0.8200 | |
| Stochastique (14,3,5): | 6.02 | |
| TEMA (21): | 171.12 | |
| Williams %R (14): | -91.59 | |
| Chande Momentum Oscillator (20): | -15.04 | |
| Repulse (5,40,3): | -1.5500 | |
| ROCnROLL: | 2 | |
| TRIX (15,9): | 0.1500 | |
| Courbe Coppock: | 8.62 |
| MA7: | 172.21 | |
| MA20: | 177.08 | |
| MA50: | 169.16 | |
| MA100: | 164.42 | |
| MAexp7: | 170.75 | |
| MAexp20: | 173.97 | |
| MAexp50: | 170.91 | |
| MAexp100: | 164.44 | |
| Price / MA7: | -4.36% | |
| Price / MA20: | -6.99% | |
| Price / MA50: | -2.64% | |
| Price / MA100: | +0.17% | |
| Price / MAexp7: | -3.54% | |
| Price / MAexp20: | -5.33% | |
| Price / MAexp50: | -3.63% | |
| Price / MAexp100: | +0.16% |
About author

Online


Add a comment
Comments
0 comments on the analysis META PLATFORMS - Daily