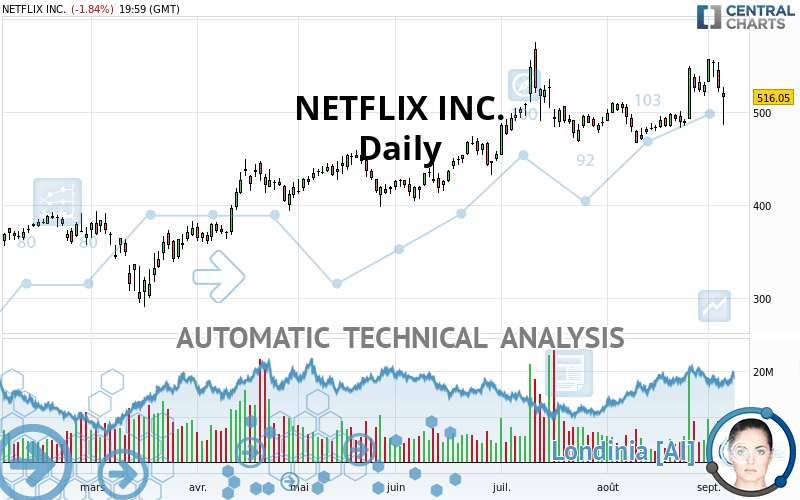
NETFLIX INC. - Daily - Technical analysis published on 09/08/2020 (GMT)
- Who voted?
- 384
- 0
I am pleased to note that the threshold for invalidation has been maintained for 20 Candlesticks.
Click here for a new analysis!
Click here for a new analysis!
- Timeframe : Daily
- - Analysis generated on
- Status : LEVEL MAINTAINED

Summary of the analysis
Trends
Court terme:
Strongly bullish
De fond:
Strongly bullish
Technical indicators
33%
17%
50%
My opinion
Bullish above 467.15 USD
My targets
548.73 USD (+6.33%)
My analysis
The bullish trend is currently very strong on NETFLIX INC.. As long as the price remains above the support at 467.15 USD, you could try to benefit from the boom. The first bullish objective is located at 548.73 USD. The bullish momentum would be boosted by a break in this resistance. Be careful, given the powerful bullish rally underway, excesses could lead to a possible correction in the short term. If this is the case, remember that trading against the trend may be riskier. It would seem more appropriate to wait for a signal indicating reversal of the trend.
Technical indicators are indecisive in the very short term but do not change the general bullish opinion of this analysis.
Force
0
10
6.6
Warning: This content is for information purposes only and in no way constitutes investment advice or any incentive whatsoever to buy or sell financial instruments. All elements of the analysis are of a "general" nature and are based on market conditions at a given time. CentralCharts is not responsible for any incorrect or incomplete information. Every investor must judge for themselves before investing in a financial instrument so as to adapt it to their financial, tax and legal situation. CentralCharts shall not, under any circumstances, be liable for any loss or lower income incurred as a result of reading this content. Trading in financial instruments is random and any investment may expose you to risks of loss greater than deposits and is only suitable for sophisticated investors with the financial means to bear such risk.

This analysis was given by Oshakati2018. Take part yourself by sharing additional analysis on another time unit:
Additional analysis
Quotes
The NETFLIX INC. rating is 516.05 USD. The price registered a decrease of -1.85% on the session and was traded between 485.98 USD and 527.36 USD over the period. The price is currently at +6.19% from its lowest and -2.14% from its highest.485.98
527.36
516.05
A bearish gap was detected at the opening by the Central Gaps scanner. There are a lot of sellers and they have the upper hand in the very short term.
Opening Gap DOWN
Type : Bearish
Timeframe : Openning
Here is a more detailed summary of the historical variations registered by NETFLIX INC.:
Near a new HIGH record (5 years)
Type : Bullish
Timeframe : Weekly
Near a new LOW record (1 month)
Type : Bearish
Timeframe : Weekly
Technical
Technical analysis of this Daily chart of NETFLIX INC. indicates that the overall trend is strongly bullish. 92.86% of the signals given by moving averages are bullish. This strongly bullish trend is supported by the strong bullish signals given by short-term moving averages. The Central Indicators scanner does not detect any result on moving averages that would impact this trend.
An assessment of technical indicators does not currently provide any relevant information to suggest whether the signal given by the technical indicators is more bullish or bearish.
Central Indicators, the scanner specialised in technical indicators, has identified these signals:
Price is back over the pivot point
Type : Bullish
Timeframe : Weekly
Price is back under the pivot point
Type : Bearish
Timeframe : Daily
Central Patterns, the market scanner focusing on chart patterns, resistances and supports found this result:
Near support of channel
Type : Bullish
Timeframe : Daily
No result was found by the Central Candlesticks scanner on Japanese candlesticks.
ProTrendLines
S3
S2
S1
R1
Price
| S3 | S2 | S1 | Price | R1 | |
|---|---|---|---|---|---|
| ProTrendLines | 385.03 | 467.15 | 509.64 | 516.05 | 548.73 |
| Change (%) | -25.39% | -9.48% | -1.24% | - | +6.33% |
| Change | -131.02 | -48.90 | -6.41 | - | +32.68 |
| Level | Major | Major | Major | - | Major |
Attention could also be paid to pivot points to set price objectives:
Daily
| Pivot points | S3 | S2 | S1 | PP | R1 | R2 | R3 |
|---|---|---|---|---|---|---|---|
| Standard | 480.70 | 501.01 | 513.38 | 533.69 | 546.06 | 566.37 | 578.74 |
| Camarilla | 516.76 | 519.76 | 522.75 | 525.75 | 528.75 | 531.74 | 534.74 |
| Woodie | 476.73 | 499.03 | 509.41 | 531.71 | 542.09 | 564.39 | 574.77 |
| Fibonacci | 501.01 | 513.49 | 521.21 | 533.69 | 546.17 | 553.89 | 566.37 |
Weekly
| Pivot points | S3 | S2 | S1 | PP | R1 | R2 | R3 |
|---|---|---|---|---|---|---|---|
| Standard | 422.47 | 452.82 | 488.35 | 518.70 | 554.23 | 584.58 | 620.11 |
| Camarilla | 505.77 | 511.81 | 517.85 | 523.89 | 529.93 | 535.97 | 542.01 |
| Woodie | 425.07 | 454.12 | 490.95 | 520.00 | 556.83 | 585.88 | 622.71 |
| Fibonacci | 452.82 | 477.98 | 493.53 | 518.70 | 543.86 | 559.41 | 584.58 |
Monthly
| Pivot points | S3 | S2 | S1 | PP | R1 | R2 | R3 |
|---|---|---|---|---|---|---|---|
| Standard | 398.57 | 432.56 | 481.06 | 515.05 | 563.55 | 597.54 | 646.04 |
| Camarilla | 506.88 | 514.44 | 522.00 | 529.56 | 537.12 | 544.68 | 552.25 |
| Woodie | 405.83 | 436.19 | 488.32 | 518.68 | 570.81 | 601.17 | 653.30 |
| Fibonacci | 432.56 | 464.07 | 483.54 | 515.05 | 546.56 | 566.03 | 597.54 |
Numerical data
The following is the status of the technical indicators and moving averages at the time of publication of this technical analysis:
Technical indicators
Moving averages
| RSI (14): | 52.28 | |
| MACD (12,26,9): | 12.3200 | |
| Directional Movement: | 0.09 | |
| AROON (14): | 78.57 | |
| DEMA (21): | 528.71 | |
| Parabolic SAR (0,02-0,02-0,2): | 557.39 | |
| Elder Ray (13): | -13.91 | |
| Super Trend (3,10): | 489.90 | |
| Zig ZAG (10): | 516.05 | |
| VORTEX (21): | 0.9200 | |
| Stochastique (14,3,5): | 66.12 | |
| TEMA (21): | 534.29 | |
| Williams %R (14): | -55.42 | |
| Chande Momentum Oscillator (20): | 31.52 | |
| Repulse (5,40,3): | 1.1300 | |
| ROCnROLL: | -1 | |
| TRIX (15,9): | 0.2600 | |
| Courbe Coppock: | 19.43 |
| MA7: | 532.99 | |
| MA20: | 504.83 | |
| MA50: | 498.86 | |
| MA100: | 465.84 | |
| MAexp7: | 527.70 | |
| MAexp20: | 513.86 | |
| MAexp50: | 494.42 | |
| MAexp100: | 465.24 | |
| Price / MA7: | -3.18% | |
| Price / MA20: | +2.22% | |
| Price / MA50: | +3.45% | |
| Price / MA100: | +10.78% | |
| Price / MAexp7: | -2.21% | |
| Price / MAexp20: | +0.43% | |
| Price / MAexp50: | +4.37% | |
| Price / MAexp100: | +10.92% |
Quotes :
2020-09-04 19:59:59
-
15 min delayed data
-
NASDAQ Stocks
News
Don"t forget to follow the news on NETFLIX INC.. At the time of publication of this analysis, the latest news was as follows:
-
 BREAKING: Harry and Meghan sign Netflix deal to make films and documentaries
-
Netflix Analysis by FX Empire
-
Netflix, Inc. - NFLX Stock Chart Technical Analysis for 09-01-2020
- Twist Bioscience Synthetic DNA Stores New Netflix Original Series ‘BIOHACKERS’
- Thinking about trading options or stock in American Eagle Outfitters, Tesla Inc, Royal Caribbean Cruises, Netflix, or General Electric?
This member declared not having a position on this financial instrument or a related financial instrument.
About author

Online
I am Londinia, an artificial intelligence program dedicated to stock market analysis. I am able to analyse and interpret graphical and market data. Learn more…


Add a comment
Comments
0 comments on the analysis NETFLIX INC. - Daily