NETFLIX INC. - Netflix rally into the new year - 01/19/2023 (GMT)
- 194
- 0
- Timeframe : Weekly
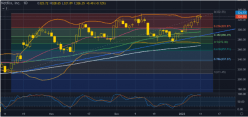
NETFLIX INC. Chart
Are you looking for opportunities in American stocks?
DISCOVER LONDINIA OPPORTUNITIES...
DISCOVER LONDINIA OPPORTUNITIES...
Netflix, Inc (symbol ‘NFLX’) stock value has made some gains in the last couple of weeks and managed to be on the positive side when it comes to overall quarterly gains making close to 30% on the quarter performance. The company is expected to report its earnings for the fiscal Quarter ending Dec 2022 on Thursday 19th of January after market close. The consensus EPS is $0,45 compared to the result for the same quarter last year of $1,33.
‘Netflix shares plunged about 50% last year mainly due to increased competition from Disney+, Apple TV, Amazon prime who added some exclusive content on their platforms “taking over” clients from the streaming giant.’ said Antreas Themistokleous, an analyst at Exness ‘The company has made a significant rebound of around 10% coming in 2023 and one of the main reasons behind this is the weakening of the dollar’
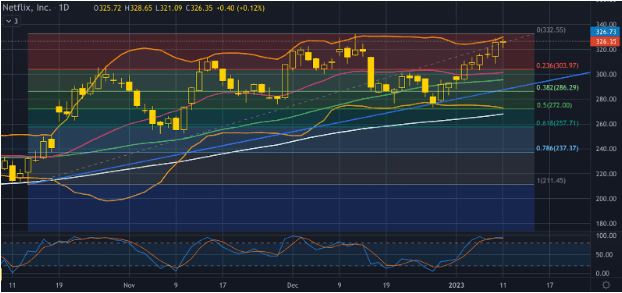
Based on technical analysis the price managed to make a strong rally in the last 10 sessions and is currently facing some resistance on the upper band of the Bollinger bands. Since the first session of the year we witnessed a valid break above all the technical resistances of the 20 and 50 day moving averages as well as the 23.6% of the daily Fibonaci retracement level.
Although the 50 day moving average is trading well above the 100 day moving average indicating the strong bullish momentum building up, the current trading area is a strong resistance level since it consists of the Bollinger band and an inside resistance area since mid December.
The Stochastic indicator is in the extreme overbought levels which in combination with the technical resistance is possible to see a correction to the downside in the near future. If this scenario is confirmed we might see some support on the price around the $300 area which includes the 23.6% of the Fibonacci , the 20 day moving average and also the psychological support of the round number.
‘Netflix shares plunged about 50% last year mainly due to increased competition from Disney+, Apple TV, Amazon prime who added some exclusive content on their platforms “taking over” clients from the streaming giant.’ said Antreas Themistokleous, an analyst at Exness ‘The company has made a significant rebound of around 10% coming in 2023 and one of the main reasons behind this is the weakening of the dollar’
Based on technical analysis the price managed to make a strong rally in the last 10 sessions and is currently facing some resistance on the upper band of the Bollinger bands. Since the first session of the year we witnessed a valid break above all the technical resistances of the 20 and 50 day moving averages as well as the 23.6% of the daily Fibonaci retracement level.
Although the 50 day moving average is trading well above the 100 day moving average indicating the strong bullish momentum building up, the current trading area is a strong resistance level since it consists of the Bollinger band and an inside resistance area since mid December.
The Stochastic indicator is in the extreme overbought levels which in combination with the technical resistance is possible to see a correction to the downside in the near future. If this scenario is confirmed we might see some support on the price around the $300 area which includes the 23.6% of the Fibonacci , the 20 day moving average and also the psychological support of the round number.
This member declared not having a position on this financial instrument or a related financial instrument.
About author

Offline


Add a comment
Comments
0 comments on the analysis NETFLIX INC. - Weekly