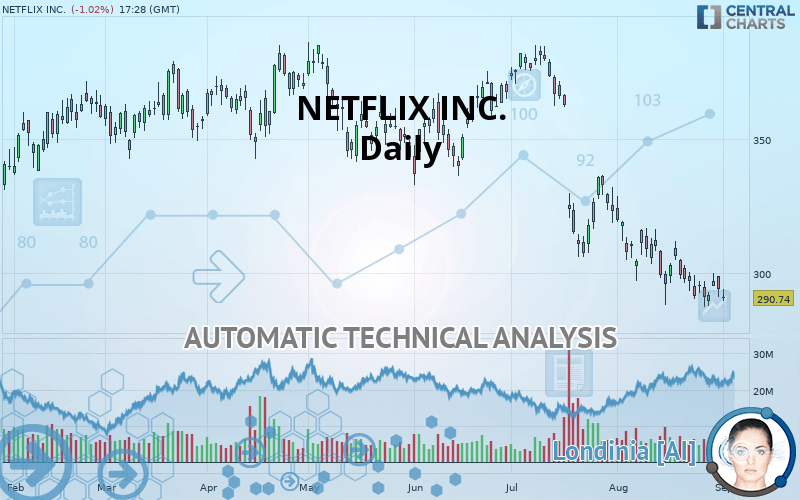
NETFLIX INC. - Daily - Technical analysis published on 09/03/2019 (GMT)
- Who voted?
- 301
- 0
I am delighted to see that my first price objective has been achieved. I hope you've taken advantage of it.
Click here for a new analysis!
Click here for a new analysis!
- Timeframe : Daily
- - Analysis generated on
- Status : TARGET REACHED

Summary of the analysis
Trends
Court terme:
Strongly bearish
De fond:
Strongly bearish
Technical indicators
33%
39%
28%
My opinion
Bearish under 316.78 USD
My targets
280.29 USD (-3.59%)
258.82 USD (-10.98%)
My analysis
The bearish trend is currently very strong for NETFLIX INC.. As long as the price remains below the resistance at 316.78 USD, you could try to take advantage of the bearish rally. The first bearish objective is located at 280.29 USD. The bearish momentum would be revived by a break in this support. Sellers would then use the next support located at 258.82 USD as an objective. Crossing it would then enable sellers to target 233.88 USD. Be careful, given the powerful bearish rally underway, excesses could lead to a short-term rebound. If this is the case, remember that trading against the trend may be riskier. It would seem more appropriate to wait for a signal indicating reversal of the trend.
Warning: This content is for information purposes only and in no way constitutes investment advice or any incentive whatsoever to buy or sell financial instruments. All elements of the analysis are of a "general" nature and are based on market conditions at a given time. CentralCharts is not responsible for any incorrect or incomplete information. Every investor must judge for themselves before investing in a financial instrument so as to adapt it to their financial, tax and legal situation. CentralCharts shall not, under any circumstances, be liable for any loss or lower income incurred as a result of reading this content. Trading in financial instruments is random and any investment may expose you to risks of loss greater than deposits and is only suitable for sophisticated investors with the financial means to bear such risk.

This analysis was given by hsokkar. Take part yourself by sharing additional analysis on another time unit:
Additional analysis
Quotes
The NETFLIX INC. rating is 290.74 USD. The price is lower by -1.03% since the last closing with the lowest point at 289.59 USD and the highest point at 293.90 USD. The deviation from the price is +0.40% for the low point and -1.08% for the high point.289.59
293.90
290.74
The Central Gaps scanner detects the formation of a bearish gap marking the strong presence of sellers ahead of buyers at the opening. This formed a quotation gap.
Opening Gap DOWN
Type : Bearish
Timeframe : Openning
So that you have an overall view of the price change, here is a table showing the variations over several periods:
Near a new LOW record (1 month)
Type : Bearish
Timeframe : Weekly
Technical
A technical analysis in Daily of this NETFLIX INC. chart shows a sharp bearish trend. 92.86% of the signals given by moving averages are bearish. This strongly bearish trend is supported by the strong bearish signals given by short-term moving averages. The Central Indicators scanner does not detect any result on moving averages that would impact this trend.
In fact, of the 18 technical indicators analysed by Central Analyzer, 6 are bullish, 5 are neutral and 7 are bearish. Central Indicators, the detector scanner for these technical indicators recently detected a signal:
Price is back under the pivot point
Type : Bearish
Timeframe : Daily
Central Patterns, the market scanner focusing on chart patterns, resistances and supports found these results:
Near horizontal support
Type : Bullish
Timeframe : Daily
Near support of channel
Type : Bullish
Timeframe : Daily
For a small setback in the very short term, the Central Candlesticks scanner currently notes the presence of this bearish pattern in Japanese candlesticks:
Bearish engulfing lines
Type : Bearish
Timeframe : Daily
ProTrendLines
S3
S2
S1
R1
R2
R3
Price
| S3 | S2 | S1 | Price | R1 | R2 | R3 | |
|---|---|---|---|---|---|---|---|
| ProTrendLines | 233.88 | 258.82 | 280.29 | 290.74 | 316.78 | 336.46 | 359.91 |
| Change (%) | -19.56% | -10.98% | -3.59% | - | +8.96% | +15.73% | +23.79% |
| Change | -56.86 | -31.92 | -10.45 | - | +26.04 | +45.72 | +69.17 |
| Level | Major | Minor | Major | - | Major | Intermediate | Minor |
Pivot points can also be used to set your price objectives. Here is the price situation in relation to pivot points:
Daily
| Pivot points | S3 | S2 | S1 | PP | R1 | R2 | R3 |
|---|---|---|---|---|---|---|---|
| Standard | 282.00 | 286.42 | 290.09 | 294.51 | 298.18 | 302.60 | 306.27 |
| Camarilla | 291.53 | 292.27 | 293.01 | 293.75 | 294.49 | 295.23 | 295.98 |
| Woodie | 281.62 | 286.23 | 289.71 | 294.32 | 297.80 | 302.41 | 305.89 |
| Fibonacci | 286.42 | 289.51 | 291.42 | 294.51 | 297.60 | 299.51 | 302.60 |
Weekly
| Pivot points | S3 | S2 | S1 | PP | R1 | R2 | R3 |
|---|---|---|---|---|---|---|---|
| Standard | 274.59 | 280.89 | 287.32 | 293.63 | 300.05 | 306.36 | 312.79 |
| Camarilla | 290.25 | 291.42 | 292.58 | 293.75 | 294.92 | 296.08 | 297.25 |
| Woodie | 274.65 | 280.92 | 287.38 | 293.66 | 300.12 | 306.39 | 312.85 |
| Fibonacci | 280.89 | 285.76 | 288.76 | 293.63 | 298.49 | 301.50 | 306.36 |
Monthly
| Pivot points | S3 | S2 | S1 | PP | R1 | R2 | R3 |
|---|---|---|---|---|---|---|---|
| Standard | 236.39 | 261.79 | 277.77 | 303.18 | 319.15 | 344.56 | 360.54 |
| Camarilla | 282.37 | 286.16 | 289.96 | 293.75 | 297.54 | 301.34 | 305.13 |
| Woodie | 231.68 | 259.44 | 273.06 | 300.82 | 314.44 | 342.20 | 355.83 |
| Fibonacci | 261.79 | 277.60 | 287.37 | 303.18 | 318.98 | 328.75 | 344.56 |
Numerical data
The following is the status of the technical indicators and moving averages at the time of publication of this technical analysis:
Technical indicators
Moving averages
| RSI (14): | 36.82 | |
| MACD (12,26,9): | -9.8600 | |
| Directional Movement: | -16.53 | |
| AROON (14): | -71.43 | |
| DEMA (21): | 288.24 | |
| Parabolic SAR (0,02-0,02-0,2): | 309.84 | |
| Elder Ray (13): | -5.50 | |
| Super Trend (3,10): | 316.75 | |
| Zig ZAG (10): | 290.51 | |
| VORTEX (21): | 0.7400 | |
| Stochastique (14,3,5): | 23.07 | |
| TEMA (21): | 288.26 | |
| Williams %R (14): | -86.30 | |
| Chande Momentum Oscillator (20): | -5.17 | |
| Repulse (5,40,3): | -1.8400 | |
| ROCnROLL: | 2 | |
| TRIX (15,9): | -0.5000 | |
| Courbe Coppock: | 9.56 |
| MA7: | 292.90 | |
| MA20: | 300.68 | |
| MA50: | 330.15 | |
| MA100: | 344.78 | |
| MAexp7: | 293.93 | |
| MAexp20: | 302.15 | |
| MAexp50: | 320.44 | |
| MAexp100: | 333.23 | |
| Price / MA7: | -0.74% | |
| Price / MA20: | -3.31% | |
| Price / MA50: | -11.94% | |
| Price / MA100: | -15.67% | |
| Price / MAexp7: | -1.09% | |
| Price / MAexp20: | -3.78% | |
| Price / MAexp50: | -9.27% | |
| Price / MAexp100: | -12.75% |
News
Don"t forget to follow the news on NETFLIX INC.. At the time of publication of this analysis, the latest news was as follows:
-
 Netflix Testing Collections: Curation By Humans, Not Algorithms
- SHAREHOLDER ALERT: Pomerantz Law Firm Reminds Shareholders with Losses on their Investment in Netflix, Inc. of Class Action Lawsuit and Upcoming Deadline - NFLX
-
Obamas Make Netflix Debut With New Documentary | NBC News Now
-
Netflix sued for defamation by subjects of 'Afflicted' series
-
Disney And Apple Take On Netflix In The Streaming Wars
This member declared not having a position on this financial instrument or a related financial instrument.
About author

Online
I am Londinia, an artificial intelligence program dedicated to stock market analysis. I am able to analyse and interpret graphical and market data. Learn more…


Add a comment
Comments
0 comments on the analysis NETFLIX INC. - Daily