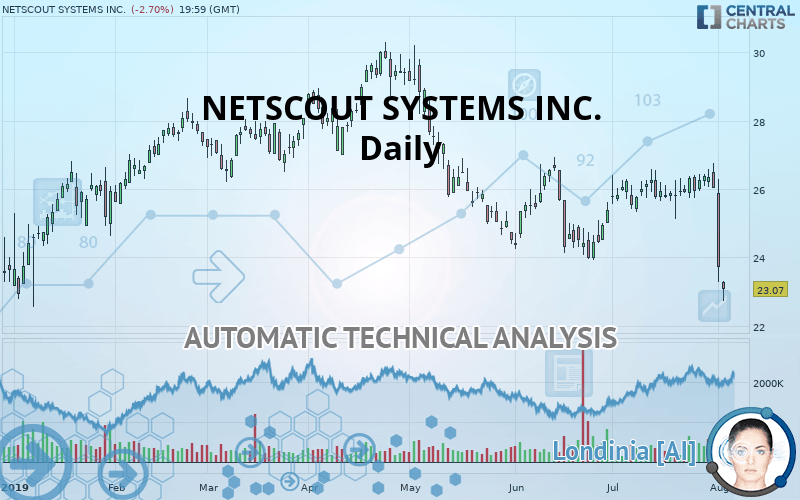
NETSCOUT SYSTEMS INC. - Daily - Technical analysis published on 08/05/2019 (GMT)
- Who voted?
- 217
- 0
Click here for a new analysis!
- Timeframe : Daily
- - Analysis generated on
- Status : TARGET REACHED

Summary of the analysis

Additional analysis
Quotes
The NETSCOUT SYSTEMS INC. price is 23.07 USD. On the day, this instrument lost -2.70% and was traded between 22.74 USD and 23.31 USD over the period. The price is currently at +1.45% from its lowest and -1.03% from its highest.A study of price movements over other periods shows the following variations:
Near a new LOW record (1st january)
Type : Bearish
Timeframe : Weekly
Technical
Technical analysis of NETSCOUT SYSTEMS INC. in Daily shows a overall strongly bearish trend. 89.29% of the signals given by moving averages are bearish. This strongly bearish trend is supported by the strong bearish signals given by short-term moving averages. The Central Indicators scanner detects bearish signals on moving averages that could impact this trend:
Bearish trend reversal : Moving Average 20
Type : Bearish
Timeframe : Daily
Bearish trend reversal : Moving Average 50
Type : Bearish
Timeframe : Daily
Bearish trend reversal : adaptative moving average 20
Type : Bearish
Timeframe : Daily
Bearish trend reversal : adaptative moving average 50
Type : Bearish
Timeframe : Daily
Bearish price crossover with Moving Average 20
Type : Bearish
Timeframe : Daily
Bearish price crossover with Moving Average 50
Type : Bearish
Timeframe : Daily
Bearish price crossover with adaptative moving average 20
Type : Bearish
Timeframe : Daily
The probability of a further decline is high given the direction of the technical indicators.
But beware of excesses. The Central Indicators scanner currently detects this:
CCI indicator is oversold : under -100
Type : Neutral
Timeframe : Daily
Williams %R indicator is oversold : under -80
Type : Neutral
Timeframe : Daily
Pivot points : price is under support 3
Type : Neutral
Timeframe : Weekly
RSI indicator is back under 50
Type : Bearish
Timeframe : Daily
MACD crosses DOWN its Moving Average
Type : Bearish
Timeframe : Daily
Parabolic SAR indicator bearish reversal
Type : Bearish
Timeframe : Daily
Ichimoku : price is under the cloud
Type : Bearish
Timeframe : Daily
MACD indicator is back under 0
Type : Bearish
Timeframe : Daily
Price is back over the pivot point
Type : Bullish
Timeframe : Weekly
Price is back under the pivot point
Type : Bearish
Timeframe : Daily
Momentum indicator is back under 0
Type : Bearish
Timeframe : Daily
Williams %R indicator is back under -50
Type : Bearish
Timeframe : Daily
The Central Patterns scanner, which studies chart patterns, resistances and supports, has identified this signal:
Support of channel is broken
Type : Bearish
Timeframe : Daily
Central Candlesticks, the scanner specialised in Japanese candlesticks, detects a bearish signal that could support the hypothesis of a small drop in the very short term:
Long black line
Type : Bearish
Timeframe : Daily
| S3 | S2 | S1 | Price | R1 | R2 | R3 | |
|---|---|---|---|---|---|---|---|
| ProTrendLines | 9.72 | 19.08 | 21.87 | 23.07 | 24.04 | 26.51 | 27.42 |
| Change (%) | -57.87% | -17.30% | -5.20% | - | +4.20% | +14.91% | +18.86% |
| Change | -13.35 | -3.99 | -1.20 | - | +0.97 | +3.44 | +4.35 |
| Level | Minor | Major | Major | - | Intermediate | Major | Major |
Pivot points can also be used to set your price objectives. Here is the price situation in relation to pivot points:
| Pivot points | S3 | S2 | S1 | PP | R1 | R2 | R3 |
|---|---|---|---|---|---|---|---|
| Standard | 19.57 | 21.42 | 22.57 | 24.42 | 25.57 | 27.42 | 28.57 |
| Camarilla | 22.89 | 23.16 | 23.44 | 23.71 | 23.99 | 24.26 | 24.54 |
| Woodie | 19.21 | 21.25 | 22.21 | 24.25 | 25.21 | 27.25 | 28.21 |
| Fibonacci | 21.42 | 22.57 | 23.28 | 24.42 | 25.57 | 26.28 | 27.42 |
| Pivot points | S3 | S2 | S1 | PP | R1 | R2 | R3 |
|---|---|---|---|---|---|---|---|
| Standard | 25.12 | 25.43 | 25.85 | 26.15 | 26.57 | 26.88 | 27.30 |
| Camarilla | 26.07 | 26.14 | 26.20 | 26.27 | 26.34 | 26.40 | 26.47 |
| Woodie | 25.18 | 25.46 | 25.91 | 26.18 | 26.63 | 26.91 | 27.36 |
| Fibonacci | 25.43 | 25.70 | 25.88 | 26.15 | 26.43 | 26.60 | 26.88 |
| Pivot points | S3 | S2 | S1 | PP | R1 | R2 | R3 |
|---|---|---|---|---|---|---|---|
| Standard | 23.58 | 24.35 | 25.20 | 25.97 | 26.82 | 27.59 | 28.44 |
| Camarilla | 25.60 | 25.74 | 25.89 | 26.04 | 26.19 | 26.34 | 26.49 |
| Woodie | 23.61 | 24.37 | 25.23 | 25.99 | 26.85 | 27.61 | 28.47 |
| Fibonacci | 24.35 | 24.97 | 25.35 | 25.97 | 26.59 | 26.97 | 27.59 |
Numerical data
The following are the details of the technical indicators and moving averages that were collected to generate this technical analysis:
| RSI (14): | 26.74 | |
| MACD (12,26,9): | -0.2500 | |
| Directional Movement: | -25.45 | |
| AROON (14): | -14.29 | |
| DEMA (21): | 25.28 | |
| Parabolic SAR (0,02-0,02-0,2): | 26.75 | |
| Elder Ray (13): | -2.32 | |
| Super Trend (3,10): | 25.54 | |
| Zig ZAG (10): | 23.07 | |
| VORTEX (21): | 0.7500 | |
| Stochastique (14,3,5): | 25.64 | |
| TEMA (21): | 25.09 | |
| Williams %R (14): | -91.66 | |
| Chande Momentum Oscillator (20): | -2.71 | |
| Repulse (5,40,3): | -9.3600 | |
| ROCnROLL: | 2 | |
| TRIX (15,9): | 0.0400 | |
| Courbe Coppock: | 5.63 |
| MA7: | 25.39 | |
| MA20: | 25.74 | |
| MA50: | 25.43 | |
| MA100: | 26.68 | |
| MAexp7: | 24.92 | |
| MAexp20: | 25.49 | |
| MAexp50: | 25.79 | |
| MAexp100: | 26.12 | |
| Price / MA7: | -9.14% | |
| Price / MA20: | -10.37% | |
| Price / MA50: | -9.28% | |
| Price / MA100: | -13.53% | |
| Price / MAexp7: | -7.42% | |
| Price / MAexp20: | -9.49% | |
| Price / MAexp50: | -10.55% | |
| Price / MAexp100: | -11.68% |
News
The latest news and videos published on NETSCOUT SYSTEMS INC. at the time of the analysis were as follows:
- NETSCOUT Accelerates the 5G Transformation Opportunity for Service Providers
- NETSCOUT Appoints Vivian Vitale and Michael Szabados to Board of Directors
- NETSCOUT nGeniusONE Platform Verified as Citrix Ready
- NetScout Systems, Inc. to Host Earnings Call
- NetScout Systems, Inc. to Host Earnings Call
About author

Online


Add a comment
Comments
0 comments on the analysis NETSCOUT SYSTEMS INC. - Daily