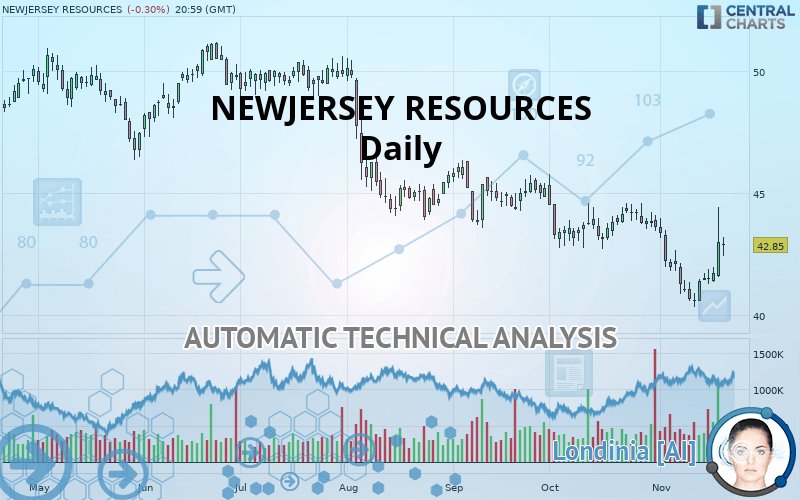
NEWJERSEY RESOURCES - Daily - Technical analysis published on 11/21/2019 (GMT)
- Who voted?
- 132
- 0
Click here for a new analysis!
- Timeframe : Daily
- - Analysis generated on
- Status : TARGET REACHED

Summary of the analysis

Additional analysis
Quotes
The NEWJERSEY RESOURCES price is 42.85 USD. The price is lower by -0.30% since the last closing and was traded between 42.42 USD and 43.19 USD over the period. The price is currently at +1.01% from its lowest and -0.79% from its highest.The Central Gaps scanner detects a bearish opening. A small advantage for sellers in the very short term.
Bearish opening
Type : Bearish
Timeframe : Openning
Here is a more detailed summary of the historical variations registered by NEWJERSEY RESOURCES:
Near a new LOW record (1 year)
Type : Bearish
Timeframe : Weekly
Near a new LOW record (1st january)
Type : Bearish
Timeframe : Weekly
Technical
Technical analysis of NEWJERSEY RESOURCES in Daily shows an overall bearish trend. 75% of the signals given by moving averages are bearish. Caution: the neutral signals currently given by short-term moving averages show us that the global trend is losing momentum. The Central Indicators market scanner is currently detecting several bullish signals that could impact this trend:
Bullish trend reversal : adaptative moving average 20
Type : Bullish
Timeframe : Daily
Bullish price crossover with Moving Average 20
Type : Bullish
Timeframe : Daily
Bullish price crossover with adaptative moving average 20
Type : Bullish
Timeframe : Daily
The technical indicators are bullish. There is still some doubt about the price increase.
But beware of excesses. The Central Indicators scanner currently detects this:
Williams %R indicator is overbought : over -20
Type : Neutral
Timeframe : Daily
Pivot points : price is over resistance 2
Type : Neutral
Timeframe : Weekly
RSI indicator is back over 50
Type : Bullish
Timeframe : Daily
MACD crosses UP its Moving Average
Type : Bullish
Timeframe : Daily
Parabolic SAR indicator bullish reversal
Type : Bullish
Timeframe : Daily
Aroon indicator bullish trend
Type : Bullish
Timeframe : Daily
SuperTrend indicator bullish reversal
Type : Bullish
Timeframe : Daily
Williams %R indicator is back over -50
Type : Bullish
Timeframe : Daily
The analysis of the price chart with Central Patterns scanners does not return any result.
Central Candlesticks, the scanner specialised in Japanese candlesticks, detects a bullish signal that could support the hypothesis of a small rebound in the very short term:
Long white line
Type : Bullish
Timeframe : Daily
| S3 | S2 | S1 | Price | R1 | R2 | R3 | |
|---|---|---|---|---|---|---|---|
| ProTrendLines | 38.70 | 40.61 | 41.65 | 42.85 | 44.11 | 46.78 | 48.50 |
| Change (%) | -9.68% | -5.23% | -2.80% | - | +2.94% | +9.17% | +13.19% |
| Change | -4.15 | -2.24 | -1.20 | - | +1.26 | +3.93 | +5.65 |
| Level | Intermediate | Major | Intermediate | - | Major | Major | Minor |
Attention could also be paid to pivot points to set price objectives:
| Pivot points | S3 | S2 | S1 | PP | R1 | R2 | R3 |
|---|---|---|---|---|---|---|---|
| Standard | 38.71 | 40.14 | 41.56 | 42.99 | 44.41 | 45.84 | 47.26 |
| Camarilla | 42.20 | 42.46 | 42.72 | 42.98 | 43.24 | 43.50 | 43.76 |
| Woodie | 38.71 | 40.14 | 41.56 | 42.99 | 44.41 | 45.84 | 47.26 |
| Fibonacci | 40.14 | 41.23 | 41.90 | 42.99 | 44.08 | 44.75 | 45.84 |
| Pivot points | S3 | S2 | S1 | PP | R1 | R2 | R3 |
|---|---|---|---|---|---|---|---|
| Standard | 38.99 | 39.65 | 40.57 | 41.23 | 42.15 | 42.81 | 43.73 |
| Camarilla | 41.05 | 41.19 | 41.34 | 41.48 | 41.63 | 41.77 | 41.91 |
| Woodie | 39.11 | 39.72 | 40.69 | 41.30 | 42.27 | 42.88 | 43.85 |
| Fibonacci | 39.65 | 40.26 | 40.63 | 41.23 | 41.84 | 42.21 | 42.81 |
| Pivot points | S3 | S2 | S1 | PP | R1 | R2 | R3 |
|---|---|---|---|---|---|---|---|
| Standard | 39.18 | 40.94 | 42.27 | 44.03 | 45.36 | 47.12 | 48.45 |
| Camarilla | 42.75 | 43.03 | 43.32 | 43.60 | 43.88 | 44.17 | 44.45 |
| Woodie | 38.97 | 40.83 | 42.06 | 43.92 | 45.15 | 47.01 | 48.24 |
| Fibonacci | 40.94 | 42.12 | 42.85 | 44.03 | 45.21 | 45.94 | 47.12 |
Numerical data
The following is the status of the technical indicators and moving averages at the time of publication of this technical analysis:
| RSI (14): | 52.83 | |
| MACD (12,26,9): | -0.4600 | |
| Directional Movement: | 14.31 | |
| AROON (14): | 35.72 | |
| DEMA (21): | 41.68 | |
| Parabolic SAR (0,02-0,02-0,2): | 40.40 | |
| Elder Ray (13): | 0.68 | |
| Super Trend (3,10): | 40.23 | |
| Zig ZAG (10): | 42.85 | |
| VORTEX (21): | 0.9200 | |
| Stochastique (14,3,5): | 54.14 | |
| TEMA (21): | 41.70 | |
| Williams %R (14): | -38.29 | |
| Chande Momentum Oscillator (20): | 0.65 | |
| Repulse (5,40,3): | 1.7600 | |
| ROCnROLL: | -1 | |
| TRIX (15,9): | -0.2100 | |
| Courbe Coppock: | 7.64 |
| MA7: | 41.79 | |
| MA20: | 42.44 | |
| MA50: | 43.46 | |
| MA100: | 45.23 | |
| MAexp7: | 42.13 | |
| MAexp20: | 42.35 | |
| MAexp50: | 43.36 | |
| MAexp100: | 44.63 | |
| Price / MA7: | +2.54% | |
| Price / MA20: | +0.97% | |
| Price / MA50: | -1.40% | |
| Price / MA100: | -5.26% | |
| Price / MAexp7: | +1.71% | |
| Price / MAexp20: | +1.18% | |
| Price / MAexp50: | -1.18% | |
| Price / MAexp100: | -3.99% |
About author

Online


Add a comment
Comments
0 comments on the analysis NEWJERSEY RESOURCES - Daily