NEWS CORP. - Daily - Technical analysis published on 12/10/2019 (GMT)
- Who voted?
- 280
- 0
Click here for a new analysis!
- Timeframe : Daily
- - Analysis generated on
- Status : INVALID
Summary of the analysis

Additional analysis
Quotes
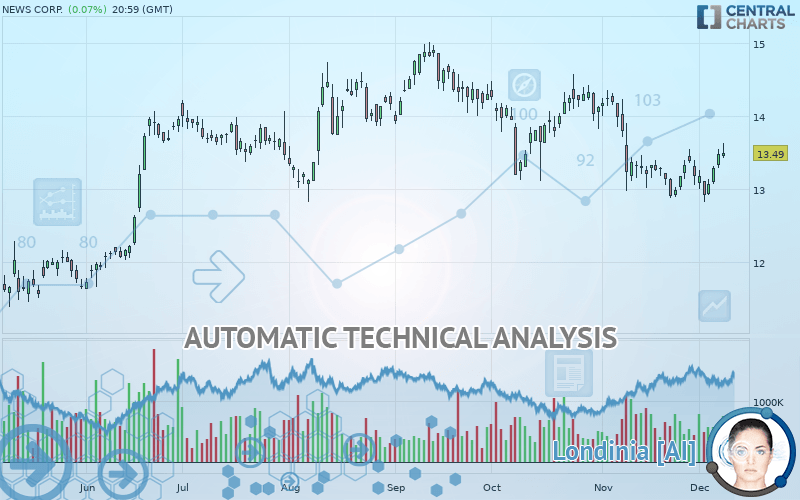
The NEWS CORP. rating is 13.49 USD. The price has increased by +0.07% since the last closing with the lowest point at 13.42 USD and the highest point at 13.63 USD. The deviation from the price is +0.52% for the low point and -1.03% for the high point.A bearish opening was detected by the Central Gaps scanner. Sellers are trying to impose a bearish trend in the very short term.
Bearish opening
Type : Bearish
Timeframe : Openning
So that you have an overall view of the price change, here is a table showing the variations over several periods:
Technical
A technical analysis in Daily of this NEWS CORP. chart shows a bearish trend. The signals given by moving averages are 71.43% bearish. This bearish trend could slow down given the neutral signals currently being given by short-term moving averages. The Central Indicators market scanner is currently detecting several bullish signals that could impact this trend:
Bullish trend reversal : adaptative moving average 20
Type : Bullish
Timeframe : Daily
Bullish price crossover with adaptative moving average 20
Type : Bullish
Timeframe : Daily
The technical indicators are bullish. There is still some doubt about the price increase.
Caution: the Central Indicators scanner currently detects an excess:
CCI indicator is overbought : over 100
Type : Neutral
Timeframe : Daily
Williams %R indicator is overbought : over -20
Type : Neutral
Timeframe : Daily
RSI indicator is back over 50
Type : Bullish
Timeframe : Daily
Parabolic SAR indicator bullish reversal
Type : Bullish
Timeframe : Daily
Price is back over the pivot point
Type : Bullish
Timeframe : Daily
Price is back over the pivot point
Type : Bullish
Timeframe : Weekly
The Central Patterns scanner, which studies chart patterns, resistances and supports, has identified these signals:
Near horizontal resistance
Type : Bearish
Timeframe : Daily
Resistance of channel is broken
Type : Bullish
Timeframe : Daily
No result was found by the Central Candlesticks scanner on Japanese candlesticks.
| S3 | S2 | S1 | Price | R1 | R2 | R3 | |
|---|---|---|---|---|---|---|---|
| ProTrendLines | 12.39 | 12.67 | 13.17 | 13.49 | 13.53 | 13.99 | 14.33 |
| Change (%) | -8.15% | -6.08% | -2.37% | - | +0.30% | +3.71% | +6.23% |
| Change | -1.10 | -0.82 | -0.32 | - | +0.04 | +0.50 | +0.84 |
| Level | Minor | Intermediate | Major | - | Intermediate | Intermediate | Major |
Pivot points can also be used to set your price objectives. Here is the price situation in relation to pivot points:
| Pivot points | S3 | S2 | S1 | PP | R1 | R2 | R3 |
|---|---|---|---|---|---|---|---|
| Standard | 13.08 | 13.18 | 13.33 | 13.44 | 13.59 | 13.69 | 13.84 |
| Camarilla | 13.41 | 13.43 | 13.46 | 13.48 | 13.50 | 13.53 | 13.55 |
| Woodie | 13.10 | 13.19 | 13.35 | 13.45 | 13.61 | 13.70 | 13.86 |
| Fibonacci | 13.18 | 13.28 | 13.34 | 13.44 | 13.53 | 13.59 | 13.69 |
| Pivot points | S3 | S2 | S1 | PP | R1 | R2 | R3 |
|---|---|---|---|---|---|---|---|
| Standard | 12.30 | 12.56 | 13.02 | 13.28 | 13.74 | 14.00 | 14.46 |
| Camarilla | 13.28 | 13.35 | 13.41 | 13.48 | 13.55 | 13.61 | 13.68 |
| Woodie | 12.40 | 12.61 | 13.12 | 13.33 | 13.84 | 14.05 | 14.56 |
| Fibonacci | 12.56 | 12.84 | 13.01 | 13.28 | 13.56 | 13.73 | 14.00 |
| Pivot points | S3 | S2 | S1 | PP | R1 | R2 | R3 |
|---|---|---|---|---|---|---|---|
| Standard | 11.10 | 11.98 | 12.58 | 13.46 | 14.06 | 14.94 | 15.54 |
| Camarilla | 12.76 | 12.90 | 13.03 | 13.17 | 13.31 | 13.44 | 13.58 |
| Woodie | 10.95 | 11.91 | 12.43 | 13.39 | 13.91 | 14.87 | 15.39 |
| Fibonacci | 11.98 | 12.55 | 12.90 | 13.46 | 14.03 | 14.38 | 14.94 |
Numerical data
The following is the status of the technical indicators and moving averages at the time of publication of this technical analysis:
| RSI (14): | 52.32 | |
| MACD (12,26,9): | -0.1200 | |
| Directional Movement: | 0.08 | |
| AROON (14): | 28.57 | |
| DEMA (21): | 13.15 | |
| Parabolic SAR (0,02-0,02-0,2): | 12.83 | |
| Elder Ray (13): | 0.25 | |
| Super Trend (3,10): | 13.74 | |
| Zig ZAG (10): | 13.49 | |
| VORTEX (21): | 0.9200 | |
| Stochastique (14,3,5): | 78.71 | |
| TEMA (21): | 13.19 | |
| Williams %R (14): | -17.28 | |
| Chande Momentum Oscillator (20): | 0.35 | |
| Repulse (5,40,3): | 1.6900 | |
| ROCnROLL: | -1 | |
| TRIX (15,9): | -0.2000 | |
| Courbe Coppock: | 0.08 |
| MA7: | 13.22 | |
| MA20: | 13.22 | |
| MA50: | 13.66 | |
| MA100: | 13.87 | |
| MAexp7: | 13.30 | |
| MAexp20: | 13.34 | |
| MAexp50: | 13.58 | |
| MAexp100: | 13.62 | |
| Price / MA7: | +2.04% | |
| Price / MA20: | +2.04% | |
| Price / MA50: | -1.24% | |
| Price / MA100: | -2.74% | |
| Price / MAexp7: | +1.43% | |
| Price / MAexp20: | +1.12% | |
| Price / MAexp50: | -0.66% | |
| Price / MAexp100: | -0.95% |
About author

Online


Add a comment
Comments
0 comments on the analysis NEWS CORP. - Daily