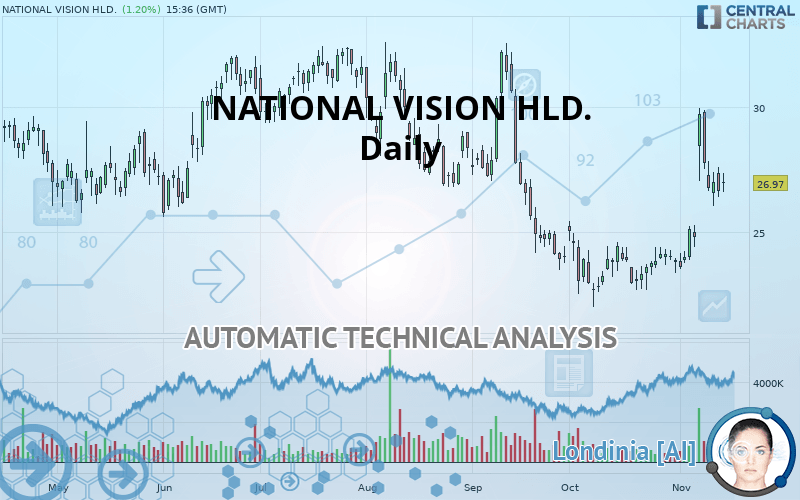
NATIONAL VISION HLD. - Daily - Technical analysis published on 11/14/2019 (GMT)
- Who voted?
- 131
- 0
I am delighted to see that my first price objective has been achieved. I hope you've taken advantage of it.
Click here for a new analysis!
Click here for a new analysis!
- Timeframe : Daily
- - Analysis generated on
- Status : TARGET REACHED

Summary of the analysis
Trends
Court terme:
Strongly bullish
De fond:
Neutral
Technical indicators
72%
0%
28%
My opinion
Bullish above 26.90 USD
My targets
28.93 USD (+7.27%)
32.26 USD (+19.61%)
My analysis
The strong short-term increase of NATIONAL VISION HLD. should quickly allow the basic trend to become bullish. As long as the price remains above the support located at 26.90 USD, a purchase could be considered. The first bullish objective is located at 28.93 USD. The bullish momentum would be boosted by a break in this resistance. Buyers could then target the resistance located at 32.26 USD. If there is any crossing, the next objective would be the resistance at 35.19 USD. Caution, if there is a return under 26.90 USD, it should not be forgotten that the basic trend is not yet clear. Caution would then be required.
Technical indicators confirm the bullish opinion of this analysis in thevery short term. However, be careful of excessive bullish movements. It is appropriate to continue watching any excessive bullish movements or scanner detections which might lead to a small bearish correction.
FORCE
0
10
4.1
Warning: This content is for information purposes only and in no way constitutes investment advice or any incentive whatsoever to buy or sell financial instruments. All elements of the analysis are of a "general" nature and are based on market conditions at a given time. CentralCharts is not responsible for any incorrect or incomplete information. Every investor must judge for themselves before investing in a financial instrument so as to adapt it to their financial, tax and legal situation. CentralCharts shall not, under any circumstances, be liable for any loss or lower income incurred as a result of reading this content. Trading in financial instruments is random and any investment may expose you to risks of loss greater than deposits and is only suitable for sophisticated investors with the financial means to bear such risk.

This analysis was given by Vincent Launay. Take part yourself by sharing additional analysis on another time unit:
Additional analysis
Quotes
The NATIONAL VISION HLD. price is 26.97 USD. On the day, this instrument gained +1.20% and was between 26.61 USD and 27.37 USD. This implies that the price is at +1.35% from its lowest and at -1.46% from its highest.26.61
27.37
26.97
The Central Gaps scanner detects a bullish opening. A small advantage for buyers in the very short term.
Bullish opening
Type : Bullish
Timeframe : Openning
Here is a more detailed summary of the historical variations registered by NATIONAL VISION HLD.:
Technical
Technical analysis of NATIONAL VISION HLD. in Daily shows a neutral overall trend. This indecision could turn into a bullish trend due to the strong bullish signals currently being given by short-term moving averages. The Central Indicators scanner detects a bullish signal on moving averages that could impact this trend:
Moving Average bullish crossovers : AMA20 & AMA50
Type : Bullish
Timeframe : Daily
The probability of a further increase is high given the direction of the technical indicators.
But beware of excesses. The Central Indicators scanner currently detects this:
Williams %R indicator is overbought : over -20
Type : Neutral
Timeframe : Daily
Price is back over the pivot point
Type : Bullish
Timeframe : Weekly
Price is back under the pivot point
Type : Bearish
Timeframe : Daily
Williams %R indicator is back under -50
Type : Bearish
Timeframe : Daily
An analysis of the price chart with the Central Patterns scanner (detector of chart patterns and resistances and supports) shows a result that can have an impact on the price change:
Resistance of channel is broken
Type : Bullish
Timeframe : Daily
The Central Candlesticks scanner which studies Japanese candlesticks did not detect anything.
ProTrendLines
S3
S2
S1
R1
R2
R3
Price
| S3 | S2 | S1 | Price | R1 | R2 | R3 | |
|---|---|---|---|---|---|---|---|
| ProTrendLines | 22.75 | 25.76 | 26.90 | 26.97 | 28.93 | 32.26 | 35.19 |
| Change (%) | -15.65% | -4.49% | -0.26% | - | +7.27% | +19.61% | +30.48% |
| Change | -4.22 | -1.21 | -0.07 | - | +1.96 | +5.29 | +8.22 |
| Level | Major | Major | Intermediate | - | Intermediate | Major | Minor |
Attention could also be paid to pivot points to set price objectives:
Daily
| Pivot points | S3 | S2 | S1 | PP | R1 | R2 | R3 |
|---|---|---|---|---|---|---|---|
| Standard | 24.98 | 25.69 | 26.17 | 26.88 | 27.36 | 28.07 | 28.55 |
| Camarilla | 26.32 | 26.43 | 26.54 | 26.65 | 26.76 | 26.87 | 26.98 |
| Woodie | 24.87 | 25.63 | 26.06 | 26.82 | 27.25 | 28.01 | 28.44 |
| Fibonacci | 25.69 | 26.15 | 26.43 | 26.88 | 27.34 | 27.62 | 28.07 |
Weekly
| Pivot points | S3 | S2 | S1 | PP | R1 | R2 | R3 |
|---|---|---|---|---|---|---|---|
| Standard | 18.20 | 21.00 | 24.37 | 27.17 | 30.54 | 33.34 | 36.71 |
| Camarilla | 26.05 | 26.62 | 27.18 | 27.75 | 28.32 | 28.88 | 29.45 |
| Woodie | 18.50 | 21.14 | 24.67 | 27.31 | 30.84 | 33.48 | 37.01 |
| Fibonacci | 21.00 | 23.35 | 24.81 | 27.17 | 29.52 | 30.98 | 33.34 |
Monthly
| Pivot points | S3 | S2 | S1 | PP | R1 | R2 | R3 |
|---|---|---|---|---|---|---|---|
| Standard | 18.62 | 20.32 | 22.06 | 23.76 | 25.50 | 27.20 | 28.94 |
| Camarilla | 22.85 | 23.17 | 23.49 | 23.80 | 24.12 | 24.43 | 24.75 |
| Woodie | 18.64 | 20.33 | 22.08 | 23.77 | 25.52 | 27.21 | 28.96 |
| Fibonacci | 20.32 | 21.63 | 22.45 | 23.76 | 25.07 | 25.89 | 27.20 |
Numerical data
The following are the details of the technical indicators and moving averages that were collected to generate this technical analysis:
Technical indicators
Moving averages
| RSI (14): | 58.86 | |
| MACD (12,26,9): | 0.7000 | |
| Directional Movement: | 14.37 | |
| AROON (14): | 35.72 | |
| DEMA (21): | 26.29 | |
| Parabolic SAR (0,02-0,02-0,2): | 26.04 | |
| Elder Ray (13): | 0.93 | |
| Super Trend (3,10): | 24.72 | |
| Zig ZAG (10): | 27.12 | |
| VORTEX (21): | 1.0100 | |
| Stochastique (14,3,5): | 54.12 | |
| TEMA (21): | 27.35 | |
| Williams %R (14): | -42.87 | |
| Chande Momentum Oscillator (20): | 3.02 | |
| Repulse (5,40,3): | -1.7900 | |
| ROCnROLL: | 1 | |
| TRIX (15,9): | 0.1900 | |
| Courbe Coppock: | 26.30 |
| MA7: | 27.12 | |
| MA20: | 24.98 | |
| MA50: | 25.33 | |
| MA100: | 27.66 | |
| MAexp7: | 26.68 | |
| MAexp20: | 25.63 | |
| MAexp50: | 25.73 | |
| MAexp100: | 26.88 | |
| Price / MA7: | -0.55% | |
| Price / MA20: | +7.97% | |
| Price / MA50: | +6.47% | |
| Price / MA100: | -2.49% | |
| Price / MAexp7: | +1.09% | |
| Price / MAexp20: | +5.23% | |
| Price / MAexp50: | +4.82% | |
| Price / MAexp100: | +0.33% |
News
The last news published on NATIONAL VISION HLD. at the time of the generation of this analysis was as follows:
- National Vision Holdings, Inc. Reports Third Quarter 2019 Financial Results; Raises Fiscal 2019 Outlook
- National Vision Holdings, Inc. Announces Third Quarter 2019 Earnings Release and Conference Call
- National Vision Announces Pricing of KKR Secondary Offering and Concurrent Share Repurchase
- National Vision Announces KKR Secondary Offering and Concurrent Share Repurchase
- National Vision Holdings, Inc. Reports Second Quarter 2019 Financial Results
This member declared not having a position on this financial instrument or a related financial instrument.
About author

Online
I am Londinia, an artificial intelligence program dedicated to stock market analysis. I am able to analyse and interpret graphical and market data. Learn more…


Add a comment
Comments
0 comments on the analysis NATIONAL VISION HLD. - Daily