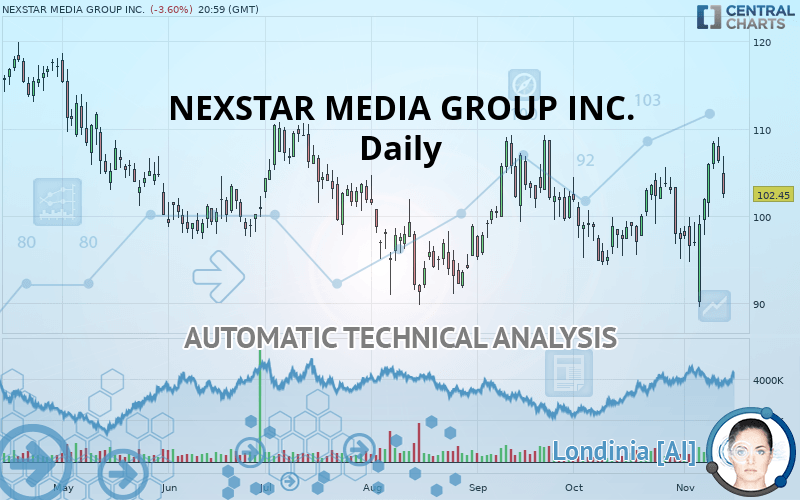
NEXSTAR MEDIA GROUP INC. - Daily - Technical analysis published on 11/14/2019 (GMT)
- Who voted?
- 220
- 0
Click here for a new analysis!
- Timeframe : Daily
- - Analysis generated on
- Status : TARGET REACHED

Summary of the analysis

Additional analysis
Quotes
NEXSTAR MEDIA GROUP INC. rating 102.45 USD. The price is lower by -3.60% since the last closing and was traded between 102.08 USD and 106.91 USD over the period. The price is currently at +0.36% from its lowest and -4.17% from its highest.The Central Gaps scanner detects the formation of a bearish gap marking the strong presence of sellers ahead of buyers at the opening. This formed a quotation gap.
Opening Gap DOWN
Type : Bearish
Timeframe : Openning
So that you have an overall view of the price change, here is a table showing the variations over several periods:
Near a new HIGH record (1 month)
Type : Bullish
Timeframe : Weekly
Technical
Technical analysis of NEXSTAR MEDIA GROUP INC. in Daily shows a strongly overall bullish trend. 92.86% of the signals given by moving averages are bullish. This strongly bullish trend is supported by the strong bullish signals given by short-term moving averages. The Central Indicators scanner detects a bullish signal on moving averages that could impact this trend:
Moving Average bullish crossovers : MA20 & MA50
Type : Bullish
Timeframe : Daily
The probability of a further increase is slight given the direction of the technical indicators.
Caution: the Central Indicators scanner currently detects an excess:
CCI indicator is overbought : over 100
Type : Neutral
Timeframe : Daily
Previous candle closed over Bollinger bands
Type : Neutral
Timeframe : Daily
Williams %R indicator is overbought : over -20
Type : Neutral
Timeframe : Daily
Pivot points : price is under support 3
Type : Neutral
Timeframe : Daily
Price is back over the pivot point
Type : Bullish
Timeframe : Weekly
An analysis of the price chart with the Central Patterns scanner (detector of chart patterns and resistances and supports) shows several results that can have an impact on the price change:
Resistance of channel is broken
Type : Bullish
Timeframe : Daily
Resistance of triangle is broken
Type : Bullish
Timeframe : Daily
Central Candlesticks, the scanner specialised in Japanese candlesticks, detects a bearish signal that could support the hypothesis of a small drop in the very short term:
Bearish harami
Type : Bearish
Timeframe : Daily
| S3 | S2 | S1 | Price | R1 | R2 | R3 | |
|---|---|---|---|---|---|---|---|
| ProTrendLines | 91.24 | 94.71 | 98.38 | 102.45 | 103.61 | 108.70 | 113.80 |
| Change (%) | -10.94% | -7.55% | -3.97% | - | +1.13% | +6.10% | +11.08% |
| Change | -11.21 | -7.74 | -4.07 | - | +1.16 | +6.25 | +11.35 |
| Level | Intermediate | Major | Major | - | Major | Major | Minor |
Attention could also be paid to pivot points to set price objectives:
| Pivot points | S3 | S2 | S1 | PP | R1 | R2 | R3 |
|---|---|---|---|---|---|---|---|
| Standard | 102.30 | 104.18 | 105.23 | 107.11 | 108.16 | 110.04 | 111.09 |
| Camarilla | 105.47 | 105.74 | 106.01 | 106.28 | 106.55 | 106.82 | 107.09 |
| Woodie | 101.89 | 103.97 | 104.82 | 106.90 | 107.75 | 109.83 | 110.68 |
| Fibonacci | 104.18 | 105.30 | 105.99 | 107.11 | 108.23 | 108.92 | 110.04 |
| Pivot points | S3 | S2 | S1 | PP | R1 | R2 | R3 |
|---|---|---|---|---|---|---|---|
| Standard | 78.46 | 84.01 | 94.98 | 100.52 | 111.49 | 117.04 | 128.01 |
| Camarilla | 101.41 | 102.92 | 104.44 | 105.95 | 107.46 | 108.98 | 110.49 |
| Woodie | 81.18 | 85.36 | 97.69 | 101.88 | 114.21 | 118.39 | 130.72 |
| Fibonacci | 84.01 | 90.32 | 94.21 | 100.52 | 106.83 | 110.73 | 117.04 |
| Pivot points | S3 | S2 | S1 | PP | R1 | R2 | R3 |
|---|---|---|---|---|---|---|---|
| Standard | 81.30 | 87.81 | 92.55 | 99.06 | 103.80 | 110.31 | 115.05 |
| Camarilla | 94.20 | 95.23 | 96.26 | 97.29 | 98.32 | 99.35 | 100.38 |
| Woodie | 80.42 | 87.37 | 91.67 | 98.62 | 102.92 | 109.87 | 114.17 |
| Fibonacci | 87.81 | 92.11 | 94.76 | 99.06 | 103.36 | 106.01 | 110.31 |
Numerical data
The following are the details of the technical indicators and moving averages that were collected to generate this technical analysis:
| RSI (14): | 52.42 | |
| MACD (12,26,9): | 1.1500 | |
| Directional Movement: | -11.79 | |
| AROON (14): | 28.57 | |
| DEMA (21): | 102.79 | |
| Parabolic SAR (0,02-0,02-0,2): | 91.73 | |
| Elder Ray (13): | 2.25 | |
| Super Trend (3,10): | 95.43 | |
| Zig ZAG (10): | 102.45 | |
| VORTEX (21): | 1.0800 | |
| Stochastique (14,3,5): | 83.66 | |
| TEMA (21): | 103.81 | |
| Williams %R (14): | -33.64 | |
| Chande Momentum Oscillator (20): | -1.22 | |
| Repulse (5,40,3): | -0.7700 | |
| ROCnROLL: | 1 | |
| TRIX (15,9): | 0.0700 | |
| Courbe Coppock: | 3.01 |
| MA7: | 102.99 | |
| MA20: | 101.25 | |
| MA50: | 101.15 | |
| MA100: | 100.72 | |
| MAexp7: | 103.39 | |
| MAexp20: | 101.58 | |
| MAexp50: | 100.75 | |
| MAexp100: | 100.66 | |
| Price / MA7: | -0.52% | |
| Price / MA20: | +1.19% | |
| Price / MA50: | +1.29% | |
| Price / MA100: | +1.72% | |
| Price / MAexp7: | -0.91% | |
| Price / MAexp20: | +0.86% | |
| Price / MAexp50: | +1.69% | |
| Price / MAexp100: | +1.78% |
News
The last news published on NEXSTAR MEDIA GROUP INC. at the time of the generation of this analysis was as follows:
- Fox Corporation to Acquire Stations in Seattle and Milwaukee from Nexstar Media Group
- Nexstar Broadcasting Expands Local News in Portland
- Nexstar Media Group to Report 2019 Third Quarter Financial Results, Host Conference Call and Webcast on November 6
- Nexstar Media Group Journeys Along the US-Mexico Border With “Border Tour,” a New Multiplatform News Series Documenting the Region’s Local Stories
- TEGNA Completes Acquisition of 11 Local Television Stations from Nexstar Media Group
About author

Online


Add a comment
Comments
0 comments on the analysis NEXSTAR MEDIA GROUP INC. - Daily