ARCELORMITTAL SA - Daily - Technical analysis published on 03/01/2023 (GMT)
- 133
- 0
Click here for a new analysis!
- Timeframe : Daily
- - Analysis generated on
- Status : INVALID
Summary of the analysis

Additional analysis
Quotes
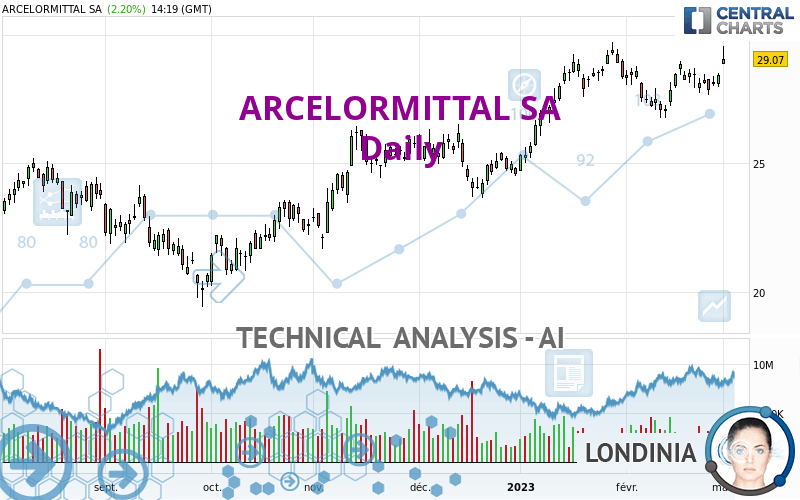
The ARCELORMITTAL SA rating is 29.065 EUR. On the day, this instrument gained +2.18% and was between 28.860 EUR and 29.560 EUR. This implies that the price is at +0.71% from its lowest and at -1.67% from its highest.The Central Gaps scanner detects a bullish gap which is a sign that buyers have taken the lead in the very short term.
Opening Gap UP
Type : Bullish
Timeframe : Openning
A study of price movements over other periods shows the following variations:
Near a new HIGH record (1st january)
Type : Bullish
Timeframe : Weekly
New HIGH record (1 month)
Type : Bullish
Timeframe : Weekly
Technical
Technical analysis of this Daily chart of ARCELORMITTAL SA indicates that the overall trend is strongly bullish. The signals given by the moving averages are 92.86% bullish. This strong bullish trend is confirmed by the strong signals currently being given by short-term moving averages. An assessment of moving averages reveals a bullish signal that could impact this trend:
Bullish trend reversal : Moving Average 20
Type : Bullish
Timeframe : Daily
In fact, 12 technical indicators on 18 studied are currently bullish. Caution: the Central Indicators scanner currently detects an excess:
CCI indicator is overbought : over 100
Type : Neutral
Timeframe : Daily
Williams %R indicator is overbought : over -20
Type : Neutral
Timeframe : Daily
Pivot points : price is over resistance 2
Type : Neutral
Timeframe : Daily
Pivot points : price is over resistance 2
Type : Neutral
Timeframe : Weekly
MACD crosses UP its Moving Average
Type : Bullish
Timeframe : Daily
SuperTrend indicator bullish reversal
Type : Bullish
Timeframe : Daily
An analysis of the price chart with the Central Patterns scanner (detector of chart patterns and resistances and supports) shows several results that can have an impact on the price change:
Horizontal resistance is broken
Type : Bullish
Timeframe : Daily
Resistance of channel is broken
Type : Bullish
Timeframe : Daily
From the Japanese candlestick perspective, the Central Candlesticks scanner notes the presence of these results that could impact the short-term trend:
White gravestone / inverted hammer
Type : Neutral
Timeframe : Daily
Upside gap
Type : Bullish
Timeframe : Daily
| S3 | S2 | S1 | Price | R1 | R2 | R3 | |
|---|---|---|---|---|---|---|---|
| ProTrendLines | 24.874 | 26.183 | 28.878 | 29.065 | 30.554 | 32.940 | 68.824 |
| Change (%) | -14.42% | -9.92% | -0.64% | - | +5.12% | +13.33% | +136.79% |
| Change | -4.191 | -2.882 | -0.187 | - | +1.489 | +3.875 | +39.759 |
| Level | Intermediate | Intermediate | Major | - | Major | Minor | Minor |
To determine price objectives, it is also possible to use the pivot points. Here is the price position in relation to pivot points:
| Pivot points | S3 | S2 | S1 | PP | R1 | R2 | R3 |
|---|---|---|---|---|---|---|---|
| Standard | 27.545 | 27.765 | 28.105 | 28.325 | 28.665 | 28.885 | 29.225 |
| Camarilla | 28.291 | 28.342 | 28.394 | 28.445 | 28.496 | 28.548 | 28.599 |
| Woodie | 27.605 | 27.795 | 28.165 | 28.355 | 28.725 | 28.915 | 29.285 |
| Fibonacci | 27.765 | 27.979 | 28.111 | 28.325 | 28.539 | 28.671 | 28.885 |
| Pivot points | S3 | S2 | S1 | PP | R1 | R2 | R3 |
|---|---|---|---|---|---|---|---|
| Standard | 26.433 | 27.057 | 27.458 | 28.082 | 28.483 | 29.107 | 29.508 |
| Camarilla | 27.578 | 27.672 | 27.766 | 27.860 | 27.954 | 28.048 | 28.142 |
| Woodie | 26.323 | 27.001 | 27.348 | 28.026 | 28.373 | 29.051 | 29.398 |
| Fibonacci | 27.057 | 27.448 | 27.690 | 28.082 | 28.473 | 28.715 | 29.107 |
| Pivot points | S3 | S2 | S1 | PP | R1 | R2 | R3 |
|---|---|---|---|---|---|---|---|
| Standard | 24.958 | 25.872 | 27.158 | 28.072 | 29.358 | 30.272 | 31.558 |
| Camarilla | 27.840 | 28.042 | 28.243 | 28.445 | 28.647 | 28.848 | 29.050 |
| Woodie | 25.145 | 25.965 | 27.345 | 28.165 | 29.545 | 30.365 | 31.745 |
| Fibonacci | 25.872 | 26.712 | 27.231 | 28.072 | 28.912 | 29.431 | 30.272 |
Numerical data
The following is the status of the technical indicators and moving averages at the time of publication of this technical analysis:
| RSI (14): | 61.48 | |
| MACD (12,26,9): | 0.2340 | |
| Directional Movement: | 13.786 | |
| AROON (14): | 92.857 | |
| DEMA (21): | 28.518 | |
| Parabolic SAR (0,02-0,02-0,2): | 27.151 | |
| Elder Ray (13): | 0.914 | |
| Super Trend (3,10): | 27.194 | |
| Zig ZAG (10): | 29.080 | |
| VORTEX (21): | 0.9430 | |
| Stochastique (14,3,5): | 73.55 | |
| TEMA (21): | 28.380 | |
| Williams %R (14): | -17.48 | |
| Chande Momentum Oscillator (20): | 1.955 | |
| Repulse (5,40,3): | 0.5200 | |
| ROCnROLL: | 1 | |
| TRIX (15,9): | 0.0990 | |
| Courbe Coppock: | 5.11 |
| MA7: | 28.324 | |
| MA20: | 28.063 | |
| MA50: | 27.524 | |
| MA100: | 25.891 | |
| MAexp7: | 28.428 | |
| MAexp20: | 28.190 | |
| MAexp50: | 27.479 | |
| MAexp100: | 26.497 | |
| Price / MA7: | +2.62% | |
| Price / MA20: | +3.57% | |
| Price / MA50: | +5.60% | |
| Price / MA100: | +12.26% | |
| Price / MAexp7: | +2.24% | |
| Price / MAexp20: | +3.10% | |
| Price / MAexp50: | +5.77% | |
| Price / MAexp100: | +9.69% |
News
The last news published on ARCELORMITTAL SA at the time of the generation of this analysis was as follows:
- ArcelorMittal reports fourth quarter 2022 results
- ArcelorMittal announces the publication of its fourth quarter 2022 sell-side analyst consensus figures
- ArcelorMittal S.A.: ArcelorMittal invests $36 million in steel decarbonisation disruptor Boston Metal
- Green Steel Technology Company Boston Metal Announces $120M Series C Financing Led by ArcelorMittal
- ArcelorMittal S.A.: ArcelorMittal inaugurates flagship carbon capture and utilisation project at its steel plant in Ghent, Belgium
About author
Online


Add a comment
Comments
0 comments on the analysis ARCELORMITTAL SA - Daily