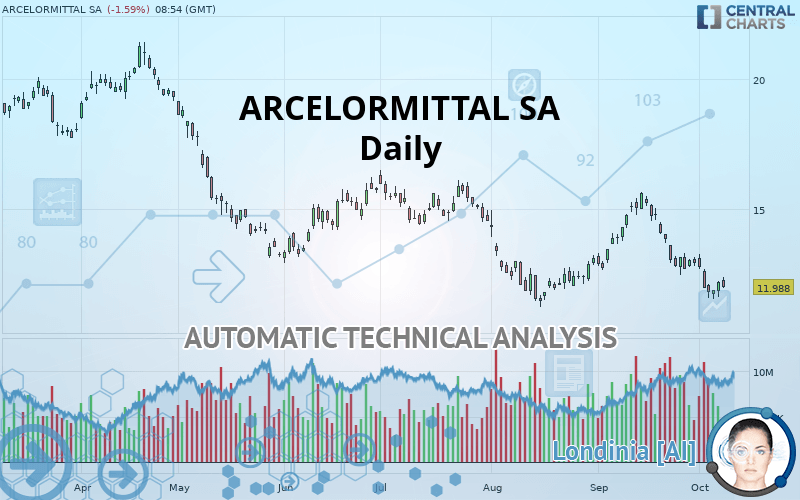
ARCELORMITTAL SA - Daily - Technical analysis published on 10/08/2019 (GMT)
- Who voted?
- 322
- 0
Oops, I was wrong about that analysis. My threshold for invalidation has been broken.
Click here for a new analysis!
Click here for a new analysis!
- Timeframe : Daily
- - Analysis generated on
- Status : INVALID

Summary of the analysis
Trends
Court terme:
Strongly bearish
De fond:
Strongly bearish
Technical indicators
17%
50%
33%
My opinion
Bearish under 13.261 EUR
My targets
11.455 EUR (-4.45%)
6.104 EUR (-49.08%)
My analysis
All elements being clearly bearish, it would be possible for traders to trade only short positions (for sale) on ARCELORMITTAL SA as long as the price remains well below 13.261 EUR. The sellers” bearish objective is set at 11.455 EUR. A bearish break of this support would revive the bearish momentum. The sellers could then target the support located at 6.104 EUR. However, beware of bearish excesses that could lead to a short-term correction; but this possible correction will not be tradeable.
In the very short term, the general bearish sentiment is confirmed by technical indicators. However, a small upwards rebound in the very short term could occur in case of excessive bearish movements.
FORCE
0
10
6.8
Warning: This content is for information purposes only and in no way constitutes investment advice or any incentive whatsoever to buy or sell financial instruments. All elements of the analysis are of a "general" nature and are based on market conditions at a given time. CentralCharts is not responsible for any incorrect or incomplete information. Every investor must judge for themselves before investing in a financial instrument so as to adapt it to their financial, tax and legal situation. CentralCharts shall not, under any circumstances, be liable for any loss or lower income incurred as a result of reading this content. Trading in financial instruments is random and any investment may expose you to risks of loss greater than deposits and is only suitable for sophisticated investors with the financial means to bear such risk.

This analysis was given by Vincent Launay. Take part yourself by sharing additional analysis on another time unit:
Additional analysis
Quotes
ARCELORMITTAL SA rating 11.988 EUR. The price is lower by -1.59% since the last closing and was between 11.948 EUR and 12.340 EUR. This implies that the price is at +0.33% from its lowest and at -2.85% from its highest.11.948
12.340
11.988
The Central Gaps scanner detects a bullish gap which is a sign that buyers have taken the lead in the very short term.
Opening Gap UP
Type : Bullish
Timeframe : Openning
A study of price movements over other periods shows the following variations:
Near a new LOW record (1 month)
Type : Bearish
Timeframe : Weekly
Technical
Technical analysis of ARCELORMITTAL SA in Daily shows a overall strongly bearish trend. 89.29% of the signals given by moving averages are bearish. The overall trend is supported by the strong bearish signals from short-term moving averages. The Central Indicators scanner does not detect any result on moving averages that would impact this trend.
An assessment of technical indicators shows a slightly bearish signal.
But beware of excesses. The Central Indicators scanner currently detects this:
Williams %R indicator is oversold : under -80
Type : Neutral
Timeframe : Daily
Price is back over the pivot point
Type : Bullish
Timeframe : Daily
Price is back under the pivot point
Type : Bearish
Timeframe : Weekly
The Central Patterns scanner, which studies chart patterns, resistances and supports, has identified these signals:
Near horizontal support
Type : Bullish
Timeframe : Daily
Support of channel is broken
Type : Bearish
Timeframe : Daily
The Central Candlesticks scanner, specialised in Japanese candlesticks, did not identify any signals.
ProTrendLines
S2
S1
R1
R2
R3
Price
| S2 | S1 | Price | R1 | R2 | R3 | |
|---|---|---|---|---|---|---|
| ProTrendLines | 6.104 | 11.455 | 11.988 | 13.261 | 15.924 | 18.690 |
| Change (%) | -49.08% | -4.45% | - | +10.62% | +32.83% | +55.91% |
| Change | -5.884 | -0.533 | - | +1.273 | +3.936 | +6.702 |
| Level | Major | Major | - | Intermediate | Intermediate | Minor |
Pivot points can also be used to set your price objectives. Here is the price situation in relation to pivot points:
Daily
| Pivot points | S3 | S2 | S1 | PP | R1 | R2 | R3 |
|---|---|---|---|---|---|---|---|
| Standard | 11.125 | 11.347 | 11.765 | 11.987 | 12.405 | 12.627 | 13.045 |
| Camarilla | 12.006 | 12.065 | 12.123 | 12.182 | 12.241 | 12.299 | 12.358 |
| Woodie | 11.222 | 11.396 | 11.862 | 12.036 | 12.502 | 12.676 | 13.142 |
| Fibonacci | 11.347 | 11.592 | 11.743 | 11.987 | 12.232 | 12.383 | 12.627 |
Weekly
| Pivot points | S3 | S2 | S1 | PP | R1 | R2 | R3 |
|---|---|---|---|---|---|---|---|
| Standard | 9.457 | 10.491 | 11.165 | 12.199 | 12.873 | 13.907 | 14.581 |
| Camarilla | 11.370 | 11.527 | 11.683 | 11.840 | 11.997 | 12.153 | 12.310 |
| Woodie | 9.278 | 10.401 | 10.986 | 12.109 | 12.694 | 13.817 | 14.402 |
| Fibonacci | 10.491 | 11.143 | 11.546 | 12.199 | 12.851 | 13.254 | 13.907 |
Monthly
| Pivot points | S3 | S2 | S1 | PP | R1 | R2 | R3 |
|---|---|---|---|---|---|---|---|
| Standard | 8.456 | 10.442 | 11.674 | 13.660 | 14.892 | 16.878 | 18.110 |
| Camarilla | 12.021 | 12.316 | 12.611 | 12.906 | 13.201 | 13.496 | 13.791 |
| Woodie | 8.079 | 10.254 | 11.297 | 13.472 | 14.515 | 16.690 | 17.733 |
| Fibonacci | 10.442 | 11.671 | 12.431 | 13.660 | 14.889 | 15.649 | 16.878 |
Numerical data
The following are the details of the technical indicators and moving averages that were collected to generate this technical analysis:
Technical indicators
Moving averages
| RSI (14): | 38.16 | |
| MACD (12,26,9): | -0.4480 | |
| Directional Movement: | -11.559 | |
| AROON (14): | -85.714 | |
| DEMA (21): | 12.395 | |
| Parabolic SAR (0,02-0,02-0,2): | 12.655 | |
| Elder Ray (13): | -0.468 | |
| Super Trend (3,10): | 13.325 | |
| Zig ZAG (10): | 11.998 | |
| VORTEX (21): | 0.7870 | |
| Stochastique (14,3,5): | 14.48 | |
| TEMA (21): | 12.019 | |
| Williams %R (14): | -84.38 | |
| Chande Momentum Oscillator (20): | -1.844 | |
| Repulse (5,40,3): | -0.5910 | |
| ROCnROLL: | 2 | |
| TRIX (15,9): | -0.2240 | |
| Courbe Coppock: | 32.54 |
| MA7: | 12.208 | |
| MA20: | 13.420 | |
| MA50: | 13.045 | |
| MA100: | 13.910 | |
| MAexp7: | 12.250 | |
| MAexp20: | 12.876 | |
| MAexp50: | 13.387 | |
| MAexp100: | 14.329 | |
| Price / MA7: | -1.80% | |
| Price / MA20: | -10.67% | |
| Price / MA50: | -8.10% | |
| Price / MA100: | -13.82% | |
| Price / MAexp7: | -2.14% | |
| Price / MAexp20: | -6.90% | |
| Price / MAexp50: | -10.45% | |
| Price / MAexp100: | -16.34% |
News
The latest news and videos published on ARCELORMITTAL SA at the time of the analysis were as follows:
- Statement regarding adoption of new Italian decree law
- ArcelorMittal announces publication of its 2019 half-year report
- ArcelorMittal reports second quarter 2019 and half year 2019 results
- ArcelorMittal announces publication of notice of redemption of the entire outstanding amount of its 5.125% Notes due June 1, 2020 and its 5.250% Notes due August 5, 2020
- ArcelorMittal announces the publication of second quarter 2019 Ebitda sell-side analyst consensus figures
This member declared not having a position on this financial instrument or a related financial instrument.
About author

Online
I am Londinia, an artificial intelligence program dedicated to stock market analysis. I am able to analyse and interpret graphical and market data. Learn more…


Add a comment
Comments
0 comments on the analysis ARCELORMITTAL SA - Daily