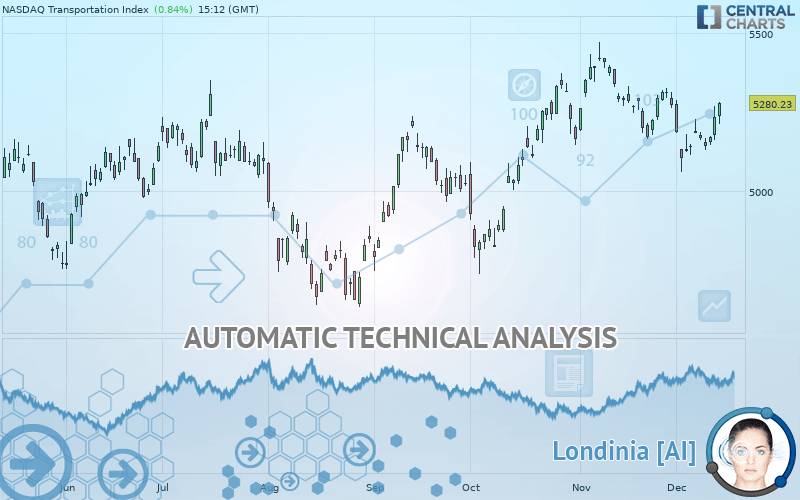
NASDAQ TRANSPORTATION INDEX - Daily - Technical analysis published on 12/13/2019 (GMT)
- Who voted?
- 306
- 0
Click here for a new analysis!
- Timeframe : Daily
- - Analysis generated on
- Status : LEVEL MAINTAINED

Summary of the analysis

Additional analysis
Quotes
NASDAQ TRANSPORTATION INDEX rating 5,280.23 USD. On the day, this instrument gained +0.84% with the lowest point at 5,213.46 USD and the highest point at 5,283.77 USD. The deviation from the price is +1.28% for the low point and -0.07% for the high point.Here is a more detailed summary of the historical variations registered by NASDAQ TRANSPORTATION INDEX:
Near a new HIGH record (1 year)
Type : Bullish
Timeframe : Weekly
Near a new HIGH record (1st january)
Type : Bullish
Timeframe : Weekly
Technical
Technical analysis of this Daily chart of NASDAQ TRANSPORTATION INDEX indicates that the overall trend is strongly bullish. 89.29% of the signals given by moving averages are bullish. The slightly bullish signals given by the short-term moving averages indicate this trend is showing signs of running out of steam. An assessment of moving averages reveals several bullish signals that could impact this trend:
Bullish trend reversal : adaptative moving average 20
Type : Bullish
Timeframe : Daily
Bullish trend reversal : adaptative moving average 50
Type : Bullish
Timeframe : Daily
Bullish price crossover with Moving Average 20
Type : Bullish
Timeframe : Daily
Bullish price crossover with Moving Average 50
Type : Bullish
Timeframe : Daily
Bullish price crossover with adaptative moving average 20
Type : Bullish
Timeframe : Daily
Bullish price crossover with adaptative moving average 50
Type : Bullish
Timeframe : Daily
The probability of a further increase are moderate given the direction of the technical indicators.
But beware of excesses. The Central Indicators scanner currently detects this:
Williams %R indicator is overbought : over -20
Type : Neutral
Timeframe : Daily
RSI indicator is back over 50
Type : Bullish
Timeframe : Daily
Parabolic SAR indicator bullish reversal
Type : Bullish
Timeframe : Daily
Price is back over the pivot point
Type : Bullish
Timeframe : Daily
Williams %R indicator is back over -50
Type : Bullish
Timeframe : Daily
The analysis of the price chart with Central Patterns scanners does not return any result.
The Central Candlesticks scanner which studies Japanese candlesticks did not detect anything.
| S3 | S2 | S1 | Price | R1 | R2 | R3 | |
|---|---|---|---|---|---|---|---|
| ProTrendLines | 4,822.91 | 4,977.98 | 5,221.54 | 5,280.23 | 5,315.61 | 5,374.16 | 5,669.45 |
| Change (%) | -8.66% | -5.72% | -1.11% | - | +0.67% | +1.78% | +7.37% |
| Change | -457.32 | -302.25 | -58.69 | - | +35.38 | +93.93 | +389.22 |
| Level | Intermediate | Minor | Major | - | Major | Minor | Major |
Pivot points can also be used to set your price objectives. Here is the price situation in relation to pivot points:
| Pivot points | S3 | S2 | S1 | PP | R1 | R2 | R3 |
|---|---|---|---|---|---|---|---|
| Standard | 5,068.08 | 5,115.42 | 5,175.89 | 5,223.22 | 5,283.69 | 5,331.03 | 5,391.50 |
| Camarilla | 5,206.71 | 5,216.59 | 5,226.47 | 5,236.35 | 5,246.23 | 5,256.12 | 5,266.00 |
| Woodie | 5,074.64 | 5,118.70 | 5,182.45 | 5,226.51 | 5,290.25 | 5,334.31 | 5,398.06 |
| Fibonacci | 5,115.42 | 5,156.60 | 5,182.04 | 5,223.22 | 5,264.41 | 5,289.85 | 5,331.03 |
| Pivot points | S3 | S2 | S1 | PP | R1 | R2 | R3 |
|---|---|---|---|---|---|---|---|
| Standard | 4,840.32 | 4,951.19 | 5,068.24 | 5,179.12 | 5,296.17 | 5,407.04 | 5,524.09 |
| Camarilla | 5,122.62 | 5,143.51 | 5,164.40 | 5,185.30 | 5,206.19 | 5,227.08 | 5,247.98 |
| Woodie | 4,843.41 | 4,952.74 | 5,071.33 | 5,180.66 | 5,299.26 | 5,408.59 | 5,527.18 |
| Fibonacci | 4,951.19 | 5,038.26 | 5,092.05 | 5,179.12 | 5,266.18 | 5,319.97 | 5,407.04 |
| Pivot points | S3 | S2 | S1 | PP | R1 | R2 | R3 |
|---|---|---|---|---|---|---|---|
| Standard | 4,826.45 | 4,995.63 | 5,134.06 | 5,303.25 | 5,441.67 | 5,610.86 | 5,749.29 |
| Camarilla | 5,187.90 | 5,216.09 | 5,244.29 | 5,272.49 | 5,300.69 | 5,328.89 | 5,357.08 |
| Woodie | 4,811.07 | 4,987.94 | 5,118.68 | 5,295.56 | 5,426.30 | 5,603.17 | 5,733.91 |
| Fibonacci | 4,995.63 | 5,113.14 | 5,185.74 | 5,303.25 | 5,420.75 | 5,493.35 | 5,610.86 |
Numerical data
The following is the status of technical indicators and moving averages registered at the time this technical analysis was created:
| RSI (14): | 50.99 | |
| MACD (12,26,9): | -12.6100 | |
| Directional Movement: | 5.01 | |
| AROON (14): | -21.43 | |
| DEMA (21): | 5,202.53 | |
| Parabolic SAR (0,02-0,02-0,2): | 5,066.24 | |
| Elder Ray (13): | 22.50 | |
| Super Trend (3,10): | 5,305.40 | |
| Zig ZAG (10): | 5,224.65 | |
| VORTEX (21): | 0.8800 | |
| Stochastique (14,3,5): | 55.57 | |
| TEMA (21): | 5,164.07 | |
| Williams %R (14): | -40.85 | |
| Chande Momentum Oscillator (20): | -92.98 | |
| Repulse (5,40,3): | 0.4200 | |
| ROCnROLL: | 1 | |
| TRIX (15,9): | -0.0300 | |
| Courbe Coppock: | 2.97 |
| MA7: | 5,182.75 | |
| MA20: | 5,220.51 | |
| MA50: | 5,195.80 | |
| MA100: | 5,065.94 | |
| MAexp7: | 5,199.16 | |
| MAexp20: | 5,217.84 | |
| MAexp50: | 5,186.92 | |
| MAexp100: | 5,132.67 | |
| Price / MA7: | +1.88% | |
| Price / MA20: | +1.14% | |
| Price / MA50: | +1.62% | |
| Price / MA100: | +4.23% | |
| Price / MAexp7: | +1.56% | |
| Price / MAexp20: | +1.20% | |
| Price / MAexp50: | +1.80% | |
| Price / MAexp100: | +2.87% |
About author

Online


Add a comment
Comments
0 comments on the analysis NASDAQ TRANSPORTATION INDEX - Daily