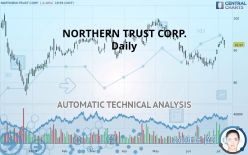
NORTHERN TRUST CORP. - Daily - Technical analysis published on 07/09/2019 (GMT)
- 281
- 0
Click here for a new analysis!
- Timeframe : Daily
- - Analysis generated on
- Status : TARGET REACHED

Summary of the analysis

Additional analysis
Quotes
NORTHERN TRUST CORP. rating 91.67 USD. The price registered a decrease of -2.40% on the session and was between 90.63 USD and 93.12 USD. This implies that the price is at +1.15% from its lowest and at -1.56% from its highest.The Central Gaps scanner detects a bullish opening marking the presence of sellers ahead of buyers at the opening but not sufficiently marked to allow the price to register a quotation gap.
Bearish opening
Type : Bearish
Timeframe : Openning
Here is a more detailed summary of the historical variations registered by NORTHERN TRUST CORP.:
Near a new HIGH record (1 month)
Type : Bullish
Timeframe : Weekly
Technical
Technical analysis of this Daily chart of NORTHERN TRUST CORP. indicates that the overall trend is not clearly defined. The strong bullish signals currently being given by short-term moving averages could allow the overall trend to return to bullish. The Central Indicators market scanner currently does not detect any result that concerns moving averages.
In fact, 12 technical indicators on 18 studied are currently bullish. But beware of excesses. The Central Indicators scanner currently detects this:
CCI indicator is overbought : over 100
Type : Neutral
Timeframe : Daily
Williams %R indicator is overbought : over -20
Type : Neutral
Timeframe : Daily
Pivot points : price is under support 1
Type : Neutral
Timeframe : Weekly
Pivot points : price is under support 3
Type : Neutral
Timeframe : Daily
Ichimoku : price is over the cloud
Type : Bullish
Timeframe : Daily
Price is back over the pivot point
Type : Bullish
Timeframe : Daily
Price is back over the pivot point
Type : Bullish
Timeframe : Weekly
The Central Patterns scanner, which studies chart patterns, resistances and supports, has identified these signals:
Near resistance of channel
Type : Bearish
Timeframe : Daily
Near resistance of triangle
Type : Bearish
Timeframe : Daily
No result was found by the Central Candlesticks scanner on Japanese candlesticks.
| S3 | S2 | S1 | Price | R1 | R2 | R3 | |
|---|---|---|---|---|---|---|---|
| ProTrendLines | 77.26 | 81.89 | 87.12 | 91.67 | 91.72 | 96.11 | 98.98 |
| Change (%) | -15.72% | -10.67% | -4.96% | - | +0.05% | +4.84% | +7.97% |
| Change | -14.41 | -9.78 | -4.55 | - | +0.05 | +4.44 | +7.31 |
| Level | Major | Minor | Major | - | Major | Intermediate | Major |
Attention could also be paid to pivot points to set price objectives:
| Pivot points | S3 | S2 | S1 | PP | R1 | R2 | R3 |
|---|---|---|---|---|---|---|---|
| Standard | 91.97 | 92.46 | 93.19 | 93.68 | 94.41 | 94.90 | 95.63 |
| Camarilla | 93.58 | 93.70 | 93.81 | 93.92 | 94.03 | 94.14 | 94.26 |
| Woodie | 92.09 | 92.52 | 93.31 | 93.74 | 94.53 | 94.96 | 95.75 |
| Fibonacci | 92.46 | 92.93 | 93.21 | 93.68 | 94.15 | 94.43 | 94.90 |
| Pivot points | S3 | S2 | S1 | PP | R1 | R2 | R3 |
|---|---|---|---|---|---|---|---|
| Standard | 88.52 | 89.70 | 91.81 | 92.99 | 95.10 | 96.28 | 98.39 |
| Camarilla | 93.02 | 93.32 | 93.62 | 93.92 | 94.22 | 94.52 | 94.82 |
| Woodie | 88.99 | 89.93 | 92.28 | 93.22 | 95.57 | 96.51 | 98.86 |
| Fibonacci | 89.70 | 90.96 | 91.73 | 92.99 | 94.25 | 95.02 | 96.28 |
Numerical data
The following are the details of the technical indicators and moving averages that were collected to generate this technical analysis:
| RSI (14): | 57.37 | |
| MACD (12,26,9): | 0.5900 | |
| Directional Movement: | 5.08 | |
| AROON (14): | 50.00 | |
| DEMA (21): | 89.84 | |
| Parabolic SAR (0,02-0,02-0,2): | 87.14 | |
| Elder Ray (13): | 1.79 | |
| Super Trend (3,10): | 88.24 | |
| Zig ZAG (10): | 91.67 | |
| VORTEX (21): | 1.0500 | |
| Stochastique (14,3,5): | 90.32 | |
| TEMA (21): | 91.47 | |
| Williams %R (14): | -24.68 | |
| Chande Momentum Oscillator (20): | 6.42 | |
| Repulse (5,40,3): | 0.5100 | |
| ROCnROLL: | 1 | |
| TRIX (15,9): | -0.0800 | |
| Courbe Coppock: | 9.88 |
| MA7: | 91.39 | |
| MA20: | 88.33 | |
| MA50: | 91.39 | |
| MA100: | 92.09 | |
| MAexp7: | 91.28 | |
| MAexp20: | 89.62 | |
| MAexp50: | 90.34 | |
| MAexp100: | 91.39 | |
| Price / MA7: | +0.31% | |
| Price / MA20: | +3.78% | |
| Price / MA50: | +0.31% | |
| Price / MA100: | -0.46% | |
| Price / MAexp7: | +0.43% | |
| Price / MAexp20: | +2.29% | |
| Price / MAexp50: | +1.47% | |
| Price / MAexp100: | +0.31% |
News
The latest news and videos published on NORTHERN TRUST CORP. at the time of the analysis were as follows:
- Northern Trust Asset Management Expands Sustainable Investing Team in Europe, Middle East and Africa
About author

Online


Add a comment
Comments
0 comments on the analysis NORTHERN TRUST CORP. - Daily