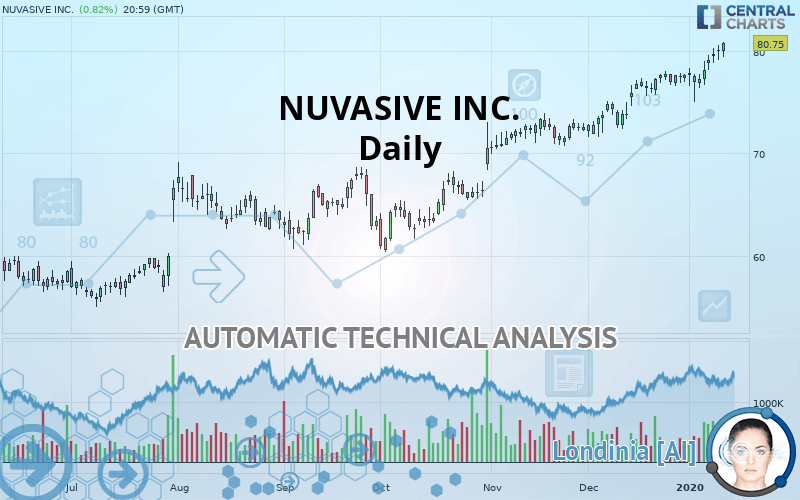
NUVASIVE INC. - Daily - Technical analysis published on 01/14/2020 (GMT)
- Who voted?
- 166
- 0
Click here for a new analysis!
- Timeframe : Daily
- - Analysis generated on
- Status : LEVEL MAINTAINED

Summary of the analysis
Additional analysis
Quotes
NUVASIVE INC. rating 80.75 USD. On the day, this instrument gained +0.82% and was traded between 79.38 USD and 80.83 USD over the period. The price is currently at +1.73% from its lowest and -0.10% from its highest.The Central Gaps scanner detects a bearish opening. A small advantage for sellers in the very short term.
Bearish opening
Type : Bearish
Timeframe : Openning
A study of price movements over other periods shows the following variations:
Near a new HIGH record (5 years)
Type : Bullish
Timeframe : Weekly
New HIGH record (1 year)
Type : Bullish
Timeframe : Weekly
New HIGH record (1st january)
Type : Bullish
Timeframe : Weekly
New HIGH record (1 month)
Type : Bullish
Timeframe : Weekly
Technical
Technical analysis of NUVASIVE INC. in Daily shows a strongly overall bullish trend. The signals given by the moving averages are 92.86% bullish. This strong bullish trend is confirmed by the strong signals currently being given by short-term moving averages. There is no crossing of moving average by the price or crossing of moving averages between themselves.
An assessment of technical indicators shows a strong bullish signal.
Caution: the Central Indicators scanner currently detects an excess:
RSI indicator is overbought : over 70
Type : Neutral
Timeframe : Daily
CCI indicator is overbought : over 100
Type : Neutral
Timeframe : Daily
CCI indicator: bearish divergence
Type : Bearish
Timeframe : Daily
Williams %R indicator is overbought : over -20
Type : Neutral
Timeframe : Daily
Pivot points : price is over resistance 1
Type : Neutral
Timeframe : Daily
Price is back over the pivot point
Type : Bullish
Timeframe : Weekly
No signals are given by Central Patterns, a market scanner specialised in chart patterns, resistances and supports.
No result was found by the Central Candlesticks scanner on Japanese candlesticks.
| S3 | S2 | S1 | Price | R1 | |
|---|---|---|---|---|---|
| ProTrendLines | 68.18 | 71.41 | 75.83 | 80.75 | 81.11 |
| Change (%) | -15.57% | -11.57% | -6.09% | - | +0.45% |
| Change | -12.57 | -9.34 | -4.92 | - | +0.36 |
| Level | Major | Major | Intermediate | - | Major |
Pivot points can also be used to set your price objectives. Here is the price situation in relation to pivot points:
| Pivot points | S3 | S2 | S1 | PP | R1 | R2 | R3 |
|---|---|---|---|---|---|---|---|
| Standard | 77.79 | 78.44 | 79.26 | 79.91 | 80.73 | 81.38 | 82.20 |
| Camarilla | 79.69 | 79.82 | 79.96 | 80.09 | 80.23 | 80.36 | 80.49 |
| Woodie | 77.89 | 78.48 | 79.36 | 79.95 | 80.83 | 81.42 | 82.30 |
| Fibonacci | 78.44 | 79.00 | 79.35 | 79.91 | 80.47 | 80.82 | 81.38 |
| Pivot points | S3 | S2 | S1 | PP | R1 | R2 | R3 |
|---|---|---|---|---|---|---|---|
| Standard | 73.28 | 74.82 | 77.46 | 79.00 | 81.64 | 83.18 | 85.82 |
| Camarilla | 78.94 | 79.32 | 79.71 | 80.09 | 80.47 | 80.86 | 81.24 |
| Woodie | 73.82 | 75.10 | 78.00 | 79.28 | 82.18 | 83.46 | 86.36 |
| Fibonacci | 74.82 | 76.42 | 77.41 | 79.00 | 80.60 | 81.59 | 83.18 |
| Pivot points | S3 | S2 | S1 | PP | R1 | R2 | R3 |
|---|---|---|---|---|---|---|---|
| Standard | 66.81 | 69.17 | 73.26 | 75.62 | 79.71 | 82.07 | 86.16 |
| Camarilla | 75.57 | 76.16 | 76.75 | 77.34 | 77.93 | 78.52 | 79.11 |
| Woodie | 67.67 | 69.60 | 74.12 | 76.05 | 80.57 | 82.50 | 87.02 |
| Fibonacci | 69.17 | 71.64 | 73.16 | 75.62 | 78.09 | 79.61 | 82.07 |
Numerical data
The following are the details of the technical indicators and moving averages that were collected to generate this technical analysis:
| RSI (14): | 78.11 | |
| MACD (12,26,9): | 1.6500 | |
| Directional Movement: | 14.02 | |
| AROON (14): | 42.86 | |
| DEMA (21): | 79.76 | |
| Parabolic SAR (0,02-0,02-0,2): | 75.97 | |
| Elder Ray (13): | 1.69 | |
| Super Trend (3,10): | 75.58 | |
| Zig ZAG (10): | 80.75 | |
| VORTEX (21): | 1.1900 | |
| Stochastique (14,3,5): | 93.50 | |
| TEMA (21): | 79.94 | |
| Williams %R (14): | -1.38 | |
| Chande Momentum Oscillator (20): | 3.05 | |
| Repulse (5,40,3): | 3.1200 | |
| ROCnROLL: | 1 | |
| TRIX (15,9): | 0.2900 | |
| Courbe Coppock: | 6.84 |
| MA7: | 78.93 | |
| MA20: | 77.69 | |
| MA50: | 74.51 | |
| MA100: | 69.57 | |
| MAexp7: | 79.29 | |
| MAexp20: | 77.58 | |
| MAexp50: | 74.48 | |
| MAexp100: | 70.69 | |
| Price / MA7: | +2.31% | |
| Price / MA20: | +3.94% | |
| Price / MA50: | +8.37% | |
| Price / MA100: | +16.07% | |
| Price / MAexp7: | +1.84% | |
| Price / MAexp20: | +4.09% | |
| Price / MAexp50: | +8.42% | |
| Price / MAexp100: | +14.23% |
News
Don"t forget to follow the news on NUVASIVE INC.. At the time of publication of this analysis, the latest news was as follows:
- NuVasive Announces Preliminary Unaudited Fourth Quarter and Full Year 2019 Revenue Results
- NuVasive to Participate in 38th Annual J.P. Morgan Healthcare Conference
- NuVasive Appoints Matthew K. Harbaugh as Chief Financial Officer
- NuVasive to Present at the 31st Annual Piper Jaffray Healthcare Conference
- NuVasive Receives FDA Clearance for Expanded Multi-Level Use of CoRoent Small Interlock™ System for the Cervical Spine
About author

Online


Add a comment
Comments
0 comments on the analysis NUVASIVE INC. - Daily