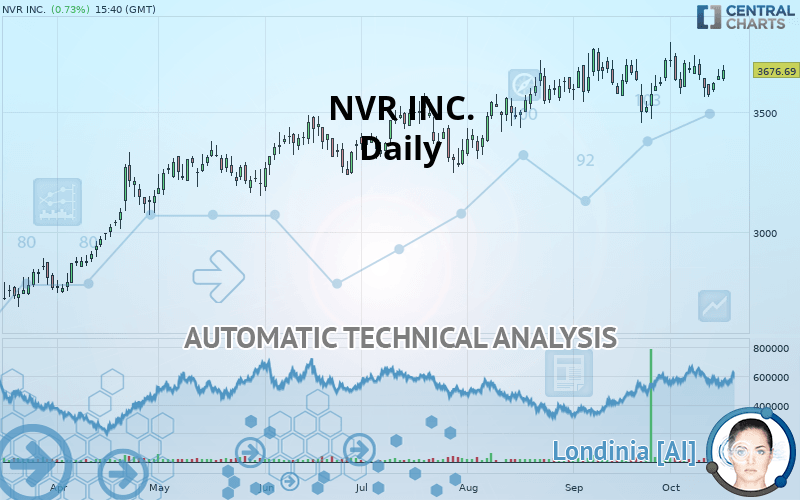
NVR INC. - Daily - Technical analysis published on 10/16/2019 (GMT)
- Who voted?
- 199
- 0
Click here for a new analysis!
- Timeframe : Daily
- - Analysis generated on
- Status : TARGET REACHED

Summary of the analysis

Additional analysis
Quotes
The NVR INC. price is 3,676.69 USD. The price registered an increase of +0.73% on the session and was traded between 3,630.93 USD and 3,697.90 USD over the period. The price is currently at +1.26% from its lowest and -0.57% from its highest.The Central Gaps scanner detects a bearish opening marking the presence of sellers ahead of buyers at the opening but not sufficiently marked to allow the price to register a quotation gap.
Bearish opening
Type : Bearish
Timeframe : Openning
A study of price movements over other periods shows the following variations:
Near a new HIGH record (5 years)
Type : Bullish
Timeframe : Weekly
Near a new HIGH record (1 year)
Type : Bullish
Timeframe : Weekly
Near a new HIGH record (1st january)
Type : Bullish
Timeframe : Weekly
The Central Volumes scanner detects abnormal volumes on the asset:
Abnormal volumes
Timeframe : 20 days
Technical
Technical analysis of this Daily chart of NVR INC. indicates that the overall trend is strongly bullish. 89.29% of the signals given by moving averages are bullish. The slightly bullish signals given by the short-term moving averages show a weakening of the global trend. The Central Indicators scanner detects bullish signals on moving averages that could impact this trend:
Bullish trend reversal : adaptative moving average 20
Type : Bullish
Timeframe : Daily
Bullish price crossover with Moving Average 20
Type : Bullish
Timeframe : Daily
An assessment of technical indicators does not currently provide any relevant information to suggest whether the signal given by the technical indicators is more bullish or bearish.
Caution: the Central Indicators scanner currently detects an excess:
Williams %R indicator is overbought : over -20
Type : Neutral
Timeframe : Daily
Pivot points : price is over resistance 1
Type : Neutral
Timeframe : Daily
Pivot points : price is over resistance 1
Type : Neutral
Timeframe : Weekly
RSI indicator is back over 50
Type : Bullish
Timeframe : Daily
Price is back under the pivot point
Type : Bearish
Timeframe : Weekly
Central Patterns, the market scanner focusing on chart patterns, resistances and supports found these results:
Near horizontal resistance
Type : Bearish
Timeframe : Daily
Resistance of channel is broken
Type : Bullish
Timeframe : Daily
Central Candlesticks, the scanner specialised in Japanese candlesticks, detects a bullish signal that could support the hypothesis of a small rebound in the very short term:
Upside gap
Type : Bullish
Timeframe : Daily
| S3 | S2 | S1 | Price | R1 | |
|---|---|---|---|---|---|
| ProTrendLines | 2,792.65 | 3,212.00 | 3,508.66 | 3,676.69 | 3,700.00 |
| Change (%) | -24.04% | -12.64% | -4.57% | - | +0.63% |
| Change | -884.04 | -464.69 | -168.03 | - | +23.31 |
| Level | Minor | Major | Major | - | Major |
To determine price objectives, it is also possible to use the pivot points. Here is the price position in relation to pivot points:
| Pivot points | S3 | S2 | S1 | PP | R1 | R2 | R3 |
|---|---|---|---|---|---|---|---|
| Standard | 3,583.59 | 3,608.84 | 3,629.49 | 3,654.74 | 3,675.39 | 3,700.64 | 3,721.29 |
| Camarilla | 3,637.51 | 3,641.72 | 3,645.92 | 3,650.13 | 3,654.34 | 3,658.55 | 3,662.75 |
| Woodie | 3,581.28 | 3,607.69 | 3,627.18 | 3,653.59 | 3,673.08 | 3,699.49 | 3,718.98 |
| Fibonacci | 3,608.84 | 3,626.38 | 3,637.21 | 3,654.74 | 3,672.28 | 3,683.11 | 3,700.64 |
| Pivot points | S3 | S2 | S1 | PP | R1 | R2 | R3 |
|---|---|---|---|---|---|---|---|
| Standard | 3,340.10 | 3,453.09 | 3,512.56 | 3,625.55 | 3,685.02 | 3,798.01 | 3,857.48 |
| Camarilla | 3,524.61 | 3,540.42 | 3,556.23 | 3,572.04 | 3,587.85 | 3,603.66 | 3,619.47 |
| Woodie | 3,313.35 | 3,439.71 | 3,485.81 | 3,612.17 | 3,658.27 | 3,784.63 | 3,830.73 |
| Fibonacci | 3,453.09 | 3,518.97 | 3,559.67 | 3,625.55 | 3,691.43 | 3,732.13 | 3,798.01 |
| Pivot points | S3 | S2 | S1 | PP | R1 | R2 | R3 |
|---|---|---|---|---|---|---|---|
| Standard | 3,214.77 | 3,336.34 | 3,526.85 | 3,648.42 | 3,838.93 | 3,960.50 | 4,151.01 |
| Camarilla | 3,631.53 | 3,660.14 | 3,688.74 | 3,717.35 | 3,745.96 | 3,774.57 | 3,803.17 |
| Woodie | 3,249.23 | 3,353.58 | 3,561.31 | 3,665.66 | 3,873.39 | 3,977.74 | 4,185.47 |
| Fibonacci | 3,336.34 | 3,455.56 | 3,529.21 | 3,648.42 | 3,767.64 | 3,841.29 | 3,960.50 |
Numerical data
The following is the status of the technical indicators and moving averages at the time of publication of this technical analysis:
| RSI (14): | 54.68 | |
| MACD (12,26,9): | 11.6600 | |
| Directional Movement: | 4.71 | |
| AROON (14): | -50.00 | |
| DEMA (21): | 3,657.02 | |
| Parabolic SAR (0,02-0,02-0,2): | 3,575.54 | |
| Elder Ray (13): | 20.95 | |
| Super Trend (3,10): | 3,458.94 | |
| Zig ZAG (10): | 3,685.17 | |
| VORTEX (21): | 1.0100 | |
| Stochastique (14,3,5): | 44.31 | |
| TEMA (21): | 3,642.47 | |
| Williams %R (14): | -50.46 | |
| Chande Momentum Oscillator (20): | -38.35 | |
| Repulse (5,40,3): | 0.9500 | |
| ROCnROLL: | 1 | |
| TRIX (15,9): | 0.0500 | |
| Courbe Coppock: | 1.62 |
| MA7: | 3,640.19 | |
| MA20: | 3,634.31 | |
| MA50: | 3,611.73 | |
| MA100: | 3,492.71 | |
| MAexp7: | 3,646.66 | |
| MAexp20: | 3,638.77 | |
| MAexp50: | 3,590.68 | |
| MAexp100: | 3,466.79 | |
| Price / MA7: | +1.00% | |
| Price / MA20: | +1.17% | |
| Price / MA50: | +1.80% | |
| Price / MA100: | +5.27% | |
| Price / MAexp7: | +0.82% | |
| Price / MAexp20: | +1.04% | |
| Price / MAexp50: | +2.40% | |
| Price / MAexp100: | +6.05% |
News
The latest news and videos published on NVR INC. at the time of the analysis were as follows:
- NVR, Inc. Announces Second Quarter Results
- NVR, Inc. Announces Share Repurchase
- NVR, Inc. Announces First Quarter Results
- NVR, Inc. Announces Fourth Quarter And Full Year Results
- NVR, Inc. Announces Share Repurchase
About author

Online


Add a comment
Comments
0 comments on the analysis NVR INC. - Daily