OCADO GRP. ORD 2P - Daily - Technical analysis published on 12/01/2019 (GMT)
- Who voted?
- 396
- 0
Click here for a new analysis!
- Timeframe : Daily
- - Analysis generated on
- Status : INVALID
Summary of the analysis

Additional analysis
Quotes
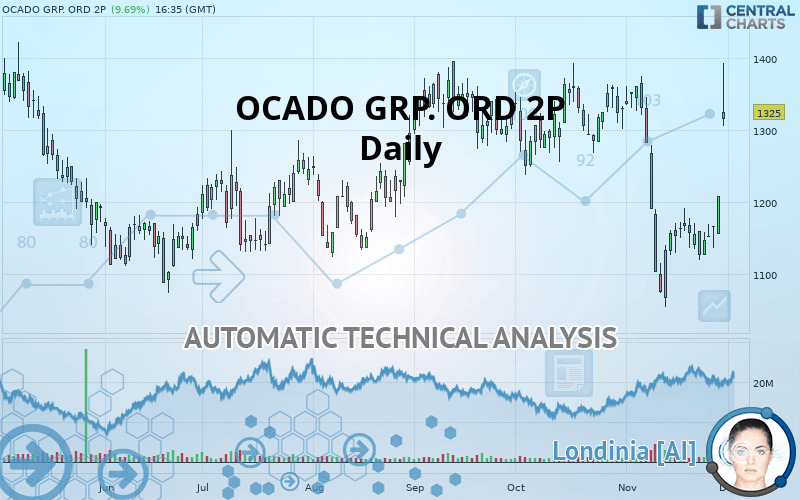
The OCADO GRP. ORD 2P rating is 1,325.0 GBX. The price has increased by +9.69% since the last closing and was between 1,305.0 GBX and 1,393.0 GBX. This implies that the price is at +1.53% from its lowest and at -4.88% from its highest.The Central Gaps scanner detects a bullish gap which is a sign that buyers have taken the lead in the very short term.
Opening Gap UP
Type : Bullish
Timeframe : Openning
So that you have an overall view of the price change, here is a table showing the variations over several periods:
Near a new HIGH record (5 years)
Type : Bullish
Timeframe : Weekly
Near a new HIGH record (1st january)
Type : Bullish
Timeframe : Weekly
Technical
Technical analysis of this Daily chart of OCADO GRP. ORD 2P indicates that the overall trend is bullish. 71.43% of the signals given by moving averages are bullish. The overall trend seems to be showing some signs of weakness, as do the tentative bullish signals given by short-term moving averages. The Central Indicators scanner detects bullish signals on moving averages that could impact this trend:
Bullish trend reversal : adaptative moving average 20
Type : Bullish
Timeframe : Daily
Bullish price crossover with Moving Average 20
Type : Bullish
Timeframe : Daily
Bullish price crossover with adaptative moving average 20
Type : Bullish
Timeframe : Daily
In fact, according to the parameters integrated into the Central Analyzer system, 13 technical indicators out of 18 analysed are currently bullish. But beware of excesses. The Central Indicators scanner currently detects this:
Williams %R indicator is overbought : over -20
Type : Neutral
Timeframe : Daily
Pivot points : price is over resistance 3
Type : Neutral
Timeframe : Daily
Pivot points : price is over resistance 3
Type : Neutral
Timeframe : Weekly
Parabolic SAR indicator bullish reversal
Type : Bullish
Timeframe : Daily
Price is back under the pivot point
Type : Bearish
Timeframe : Weekly
Williams %R indicator is back over -50
Type : Bullish
Timeframe : Daily
Central Patterns, the market scanner focusing on chart patterns, resistances and supports found this result:
Resistance of channel is broken
Type : Bullish
Timeframe : Daily
The Central Candlesticks scanner, specialised in Japanese candlesticks, did not identify any signals.
| S3 | S2 | S1 | Price | R1 | R2 | |
|---|---|---|---|---|---|---|
| ProTrendLines | 1,146.0 | 1,250.1 | 1,322.5 | 1,325.0 | 1,367.2 | 1,435.0 |
| Change (%) | -13.51% | -5.65% | -0.19% | - | +3.18% | +8.30% |
| Change | -179.0 | -74.9 | -2.5 | - | +42.2 | +110.0 |
| Level | Major | Intermediate | Major | - | Intermediate | Major |
To determine price objectives, it is also possible to use the pivot points. Here is the price position in relation to pivot points:
| Pivot points | S3 | S2 | S1 | PP | R1 | R2 | R3 |
|---|---|---|---|---|---|---|---|
| Standard | 1,120.5 | 1,138.0 | 1,173.0 | 1,190.5 | 1,225.5 | 1,243.0 | 1,278.0 |
| Camarilla | 1,193.6 | 1,198.4 | 1,203.2 | 1,208.0 | 1,212.8 | 1,217.6 | 1,222.4 |
| Woodie | 1,129.3 | 1,142.4 | 1,181.8 | 1,194.9 | 1,234.3 | 1,247.4 | 1,286.8 |
| Fibonacci | 1,138.0 | 1,158.1 | 1,170.5 | 1,190.5 | 1,210.6 | 1,223.0 | 1,243.0 |
| Pivot points | S3 | S2 | S1 | PP | R1 | R2 | R3 |
|---|---|---|---|---|---|---|---|
| Standard | 1,027.3 | 1,073.2 | 1,099.8 | 1,145.7 | 1,172.3 | 1,218.2 | 1,244.8 |
| Camarilla | 1,106.6 | 1,113.2 | 1,119.9 | 1,126.5 | 1,133.2 | 1,139.8 | 1,146.4 |
| Woodie | 1,017.8 | 1,068.4 | 1,090.3 | 1,140.9 | 1,162.8 | 1,213.4 | 1,235.3 |
| Fibonacci | 1,073.2 | 1,100.9 | 1,118.0 | 1,145.7 | 1,173.4 | 1,190.5 | 1,218.2 |
| Pivot points | S3 | S2 | S1 | PP | R1 | R2 | R3 |
|---|---|---|---|---|---|---|---|
| Standard | 1,091.2 | 1,164.3 | 1,246.7 | 1,319.8 | 1,402.2 | 1,475.3 | 1,557.7 |
| Camarilla | 1,286.2 | 1,300.5 | 1,314.8 | 1,329.0 | 1,343.3 | 1,357.5 | 1,371.8 |
| Woodie | 1,095.8 | 1,166.6 | 1,251.3 | 1,322.1 | 1,406.8 | 1,477.6 | 1,562.3 |
| Fibonacci | 1,164.3 | 1,223.7 | 1,260.4 | 1,319.8 | 1,379.2 | 1,415.9 | 1,475.3 |
Numerical data
The following are the details of the technical indicators and moving averages that were collected to generate this technical analysis:
| RSI (14): | 63.70 | |
| MACD (12,26,9): | -19.2000 | |
| Directional Movement: | 22.0 | |
| AROON (14): | 85.7 | |
| DEMA (21): | 1,174.1 | |
| Parabolic SAR (0,02-0,02-0,2): | 1,057.1 | |
| Elder Ray (13): | 151.8 | |
| Super Trend (3,10): | 1,182.6 | |
| Zig ZAG (10): | 1,325.0 | |
| VORTEX (21): | 0.9000 | |
| Stochastique (14,3,5): | 76.60 | |
| TEMA (21): | 1,176.1 | |
| Williams %R (14): | -20.10 | |
| Chande Momentum Oscillator (20): | 191.5 | |
| Repulse (5,40,3): | 2.4000 | |
| ROCnROLL: | 1 | |
| TRIX (15,9): | -0.4000 | |
| Courbe Coppock: | 3.10 |
| MA7: | 1,182.9 | |
| MA20: | 1,194.9 | |
| MA50: | 1,267.3 | |
| MA100: | 1,254.3 | |
| MAexp7: | 1,207.9 | |
| MAexp20: | 1,206.2 | |
| MAexp50: | 1,240.5 | |
| MAexp100: | 1,242.1 | |
| Price / MA7: | +12.01% | |
| Price / MA20: | +10.89% | |
| Price / MA50: | +4.55% | |
| Price / MA100: | +5.64% | |
| Price / MAexp7: | +9.69% | |
| Price / MAexp20: | +9.85% | |
| Price / MAexp50: | +6.81% | |
| Price / MAexp100: | +6.67% |
News
The last news published on OCADO GRP. ORD 2P at the time of the generation of this analysis was as follows:
- Kroger and Ocado Announce Two Additional Sites for High-Tech Customer Fulfillment Centers
-
 Are Ocado and M&S set for a tie-up?
-
Fevertree 'encouraged' with 2018 trading; Ocado rockets on US deal
-
Could Amazon be about to launch a bid for Ocado?
-
Ocado Group PLC's European deal likely to be first of many says ETX's Neil Wilson
About author

Online


Add a comment
Comments
0 comments on the analysis OCADO GRP. ORD 2P - Daily