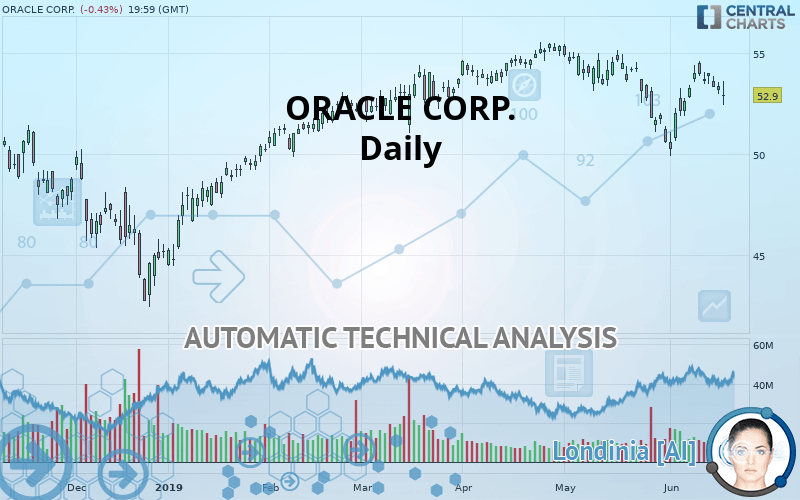
ORACLE CORP. - Daily - Technical analysis published on 06/19/2019 (GMT)
- Who voted?
- 285
- 0
Click here for a new analysis!
- Timeframe : Daily
- - Analysis generated on
- Status : INVALID

Summary of the analysis

Additional analysis
Quotes
The ORACLE CORP. rating is 52.90 USD. The price registered a decrease of -0.43% on the session and was between 52.41 USD and 53.60 USD. This implies that the price is at +0.93% from its lowest and at -1.31% from its highest.The Central Gaps scanner detects the formation of a bearish gap marking the strong presence of sellers ahead of buyers at the opening. This formed a quotation gap.
Opening Gap DOWN
Type : Bearish
Timeframe : Openning
A study of price movements over other periods shows the following variations:
Near a new HIGH record (5 years)
Type : Bullish
Timeframe : Weekly
Near a new HIGH record (1 year)
Type : Bullish
Timeframe : Weekly
Near a new HIGH record (1st january)
Type : Bullish
Timeframe : Weekly
Technical
Technical analysis of ORACLE CORP. in Daily shows an overall slightly bearish trend. 46.43% of the signals given by moving averages are bearish. The overall trend remains fragile, reflecting the slightly bearish signals given by short-term moving averages. The Central Indicators market scanner is currently detecting several bearish signals that could impact this trend:
Bearish trend reversal : adaptative moving average 20
Type : Bearish
Timeframe : Daily
Bearish trend reversal : adaptative moving average 50
Type : Bearish
Timeframe : Daily
In fact, of the 18 technical indicators analysed by Central Analyzer, 7 are bullish, 7 are neutral and 4 are bearish. Central Indicators, the scanner specialised in technical indicators, has identified these signals:
RSI indicator is back under 50
Type : Bearish
Timeframe : Daily
Ichimoku : price is under the cloud
Type : Bearish
Timeframe : Daily
Price is back under the pivot point
Type : Bearish
Timeframe : Daily
The Central Patterns scanner, which studies chart patterns, resistances and supports, has identified these signals:
Near resistance of channel
Type : Bearish
Timeframe : Daily
Near horizontal support
Type : Bullish
Timeframe : Daily
The Central Candlesticks scanner which studies Japanese candlesticks did not detect anything.
| S3 | S2 | S1 | Price | R1 | R2 | |
|---|---|---|---|---|---|---|
| ProTrendLines | 42.76 | 46.23 | 50.24 | 52.90 | 52.95 | 55.41 |
| Change (%) | -19.17% | -12.61% | -5.03% | - | +0.09% | +4.74% |
| Change | -10.14 | -6.67 | -2.66 | - | +0.05 | +2.51 |
| Level | Major | Major | Major | - | Major | Major |
Attention could also be paid to pivot points to set price objectives:
| Pivot points | S3 | S2 | S1 | PP | R1 | R2 | R3 |
|---|---|---|---|---|---|---|---|
| Standard | 52.28 | 52.61 | 52.87 | 53.21 | 53.47 | 53.80 | 54.06 |
| Camarilla | 52.97 | 53.02 | 53.08 | 53.13 | 53.18 | 53.24 | 53.29 |
| Woodie | 52.24 | 52.59 | 52.83 | 53.19 | 53.43 | 53.78 | 54.02 |
| Fibonacci | 52.61 | 52.84 | 52.98 | 53.21 | 53.44 | 53.58 | 53.80 |
| Pivot points | S3 | S2 | S1 | PP | R1 | R2 | R3 |
|---|---|---|---|---|---|---|---|
| Standard | 51.51 | 52.39 | 52.84 | 53.72 | 54.17 | 55.05 | 55.50 |
| Camarilla | 52.91 | 53.04 | 53.16 | 53.28 | 53.40 | 53.52 | 53.65 |
| Woodie | 51.28 | 52.28 | 52.62 | 53.61 | 53.94 | 54.94 | 55.28 |
| Fibonacci | 52.39 | 52.90 | 53.22 | 53.72 | 54.23 | 54.55 | 55.05 |
Numerical data
The following are the details of the technical indicators and moving averages that were collected to generate this technical analysis:
| RSI (14): | 47.45 | |
| MACD (12,26,9): | -0.0800 | |
| Directional Movement: | -5.13 | |
| AROON (14): | 42.86 | |
| DEMA (21): | 52.93 | |
| Parabolic SAR (0,02-0,02-0,2): | 51.33 | |
| Elder Ray (13): | -0.10 | |
| Super Trend (3,10): | 51.13 | |
| Zig ZAG (10): | 52.90 | |
| VORTEX (21): | 0.8400 | |
| Stochastique (14,3,5): | 68.08 | |
| TEMA (21): | 53.03 | |
| Williams %R (14): | -36.23 | |
| Chande Momentum Oscillator (20): | 2.30 | |
| Repulse (5,40,3): | -1.1700 | |
| ROCnROLL: | 2 | |
| TRIX (15,9): | -0.0700 | |
| Courbe Coppock: | 3.95 |
| MA7: | 53.53 | |
| MA20: | 52.75 | |
| MA50: | 53.78 | |
| MA100: | 52.90 | |
| MAexp7: | 53.19 | |
| MAexp20: | 53.12 | |
| MAexp50: | 53.20 | |
| MAexp100: | 52.46 | |
| Price / MA7: | -1.18% | |
| Price / MA20: | +0.28% | |
| Price / MA50: | -1.64% | |
| Price / MA100: | -0% | |
| Price / MAexp7: | -0.55% | |
| Price / MAexp20: | -0.41% | |
| Price / MAexp50: | -0.56% | |
| Price / MAexp100: | +0.84% |
News
Don"t forget to follow the news on ORACLE CORP.. At the time of publication of this analysis, the latest news was as follows:
- Oracle Data Cloud and Reddit Collaborate to Build Brand Safety Solution for Dynamic User-Generated Content
- Oracle Collaborates with Top Oracle PartnerNetwork Platinum Level Members to Rethink Customer Data Platform Market
- Oracle Moat to Measure Viewability for Samsung Ads
- New Oracle Exadata Builds in Machine Learning Advances, Supercharges Performance, Improves Cost Effectiveness
- Oracle Insights Help Retailers Right-Size Inventory for Every Store
About author

Online


Add a comment
Comments
0 comments on the analysis ORACLE CORP. - Daily