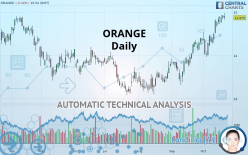
ORANGE - Daily - Technical analysis published on 10/21/2019 (GMT)
- Who voted?
- 351
- 0
Oops, I was wrong about that analysis. My threshold for invalidation has been broken.
Click here for a new analysis!
Click here for a new analysis!
- Timeframe : Daily
- - Analysis generated on
- Status : INVALID

Summary of the analysis
Trends
Court terme:
Strongly bullish
De fond:
Strongly bullish
Technical indicators
78%
6%
17%
My opinion
Bullish above 14.855 EUR
My targets
15.225 EUR (+2.35%)
15.686 EUR (+5.45%)
My analysis
The bullish trend is currently very strong on ORANGE. As long as the price remains above the support at 14.855 EUR, you could try to benefit from the boom. The first bullish objective is located at 15.225 EUR. The bullish momentum would be boosted by a break in this resistance. Buyers would then use the next resistance located at 15.686 EUR as an objective. Crossing it would then enable buyers to target 16.445 EUR. Be careful, given the powerful bullish rally underway, excesses could lead to a possible correction in the short term. If this is the case, remember that trading against the trend may be riskier. It would seem more appropriate to wait for a signal indicating reversal of the trend.
Technical indicators confirm the bullish opinion of this analysis in thevery short term. However, be careful of excessive bullish movements. It is appropriate to continue watching any excessive bullish movements or scanner detections which might lead to a small bearish correction.
FORCE
0
10
8.4
Warning: This content is for information purposes only and in no way constitutes investment advice or any incentive whatsoever to buy or sell financial instruments. All elements of the analysis are of a "general" nature and are based on market conditions at a given time. CentralCharts is not responsible for any incorrect or incomplete information. Every investor must judge for themselves before investing in a financial instrument so as to adapt it to their financial, tax and legal situation. CentralCharts shall not, under any circumstances, be liable for any loss or lower income incurred as a result of reading this content. Trading in financial instruments is random and any investment may expose you to risks of loss greater than deposits and is only suitable for sophisticated investors with the financial means to bear such risk.

This analysis was given by Vincent Launay. Take part yourself by sharing additional analysis on another time unit:
Additional analysis
Quotes
The ORANGE price is 14.875 EUR. The price is lower by -0.34% since the last closing and was traded between 14.825 EUR and 14.980 EUR over the period. The price is currently at +0.34% from its lowest and -0.70% from its highest.14.825
14.980
14.875
The Central Gaps scanner detects a bearish opening marking the presence of sellers ahead of buyers at the opening but not sufficiently marked to allow the price to register a quotation gap.
Bearish opening
Type : Bearish
Timeframe : Openning
Here is a more detailed summary of the historical variations registered by ORANGE:
New HIGH record (5 years)
Type : Bullish
Timeframe : Weekly
New HIGH record (1 year)
Type : Bullish
Timeframe : Weekly
New HIGH record (1st january)
Type : Bullish
Timeframe : Weekly
New HIGH record (1 month)
Type : Bullish
Timeframe : Weekly
Technical
Technical analysis of ORANGE in Daily shows a strongly overall bullish trend. 92.86% of the signals given by moving averages are bullish. The overall trend is supported by the strong bullish signals from short-term moving averages. The Central Indicators scanner does not detect any result on moving averages that would impact this trend.
An assessment of technical indicators shows a strong bullish signal.
But beware of excesses. The Central Indicators scanner currently detects this:
RSI indicator is overbought : over 70
Type : Neutral
Timeframe : Daily
CCI indicator is overbought : over 100
Type : Neutral
Timeframe : Daily
Williams %R indicator is overbought : over -20
Type : Neutral
Timeframe : Daily
Price is back over the pivot point
Type : Bullish
Timeframe : Daily
Price is back over the pivot point
Type : Bullish
Timeframe : Weekly
No signals are given by Central Patterns, a market scanner specialised in chart patterns, resistances and supports.
No result was found by the Central Candlesticks scanner on Japanese candlesticks.
ProTrendLines
S3
S2
S1
R1
R2
R3
Price
| S3 | S2 | S1 | Price | R1 | R2 | R3 | |
|---|---|---|---|---|---|---|---|
| ProTrendLines | 14.128 | 14.394 | 14.855 | 14.875 | 15.225 | 15.686 | 16.445 |
| Change (%) | -5.02% | -3.23% | -0.13% | - | +2.35% | +5.45% | +10.55% |
| Change | -0.747 | -0.481 | -0.020 | - | +0.350 | +0.811 | +1.570 |
| Level | Intermediate | Minor | Major | - | Minor | Major | Minor |
To determine price objectives, it is also possible to use the pivot points. Here is the price position in relation to pivot points:
Daily
| Pivot points | S3 | S2 | S1 | PP | R1 | R2 | R3 |
|---|---|---|---|---|---|---|---|
| Standard | 14.777 | 14.808 | 14.867 | 14.898 | 14.957 | 14.988 | 15.047 |
| Camarilla | 14.900 | 14.909 | 14.917 | 14.925 | 14.933 | 14.942 | 14.950 |
| Woodie | 14.790 | 14.815 | 14.880 | 14.905 | 14.970 | 14.995 | 15.060 |
| Fibonacci | 14.808 | 14.843 | 14.864 | 14.898 | 14.933 | 14.954 | 14.988 |
Weekly
| Pivot points | S3 | S2 | S1 | PP | R1 | R2 | R3 |
|---|---|---|---|---|---|---|---|
| Standard | 14.477 | 14.568 | 14.747 | 14.838 | 15.017 | 15.108 | 15.287 |
| Camarilla | 14.851 | 14.876 | 14.900 | 14.925 | 14.950 | 14.975 | 14.999 |
| Woodie | 14.520 | 14.590 | 14.790 | 14.860 | 15.060 | 15.130 | 15.330 |
| Fibonacci | 14.568 | 14.672 | 14.735 | 14.838 | 14.942 | 15.005 | 15.108 |
Monthly
| Pivot points | S3 | S2 | S1 | PP | R1 | R2 | R3 |
|---|---|---|---|---|---|---|---|
| Standard | 12.568 | 12.942 | 13.668 | 14.042 | 14.768 | 15.142 | 15.868 |
| Camarilla | 14.093 | 14.193 | 14.294 | 14.395 | 14.496 | 14.597 | 14.698 |
| Woodie | 12.745 | 13.030 | 13.845 | 14.130 | 14.945 | 15.230 | 16.045 |
| Fibonacci | 12.942 | 13.362 | 13.622 | 14.042 | 14.462 | 14.722 | 15.142 |
Numerical data
The following are the details of the technical indicators and moving averages that were collected to generate this technical analysis:
Technical indicators
Moving averages
| RSI (14): | 67.76 | |
| MACD (12,26,9): | 0.2590 | |
| Directional Movement: | 22.718 | |
| AROON (14): | 85.714 | |
| DEMA (21): | 14.851 | |
| Parabolic SAR (0,02-0,02-0,2): | 14.306 | |
| Elder Ray (13): | 0.245 | |
| Super Trend (3,10): | 14.346 | |
| Zig ZAG (10): | 14.875 | |
| VORTEX (21): | 1.1930 | |
| Stochastique (14,3,5): | 94.31 | |
| TEMA (21): | 14.945 | |
| Williams %R (14): | -10.35 | |
| Chande Momentum Oscillator (20): | 0.855 | |
| Repulse (5,40,3): | 0.8530 | |
| ROCnROLL: | 1 | |
| TRIX (15,9): | 0.2360 | |
| Courbe Coppock: | 7.63 |
| MA7: | 14.842 | |
| MA20: | 14.486 | |
| MA50: | 14.003 | |
| MA100: | 13.814 | |
| MAexp7: | 14.798 | |
| MAexp20: | 14.520 | |
| MAexp50: | 14.157 | |
| MAexp100: | 13.929 | |
| Price / MA7: | +0.22% | |
| Price / MA20: | +2.69% | |
| Price / MA50: | +6.23% | |
| Price / MA100: | +7.68% | |
| Price / MAexp7: | +0.52% | |
| Price / MAexp20: | +2.44% | |
| Price / MAexp50: | +5.07% | |
| Price / MAexp100: | +6.79% |
News
Don"t forget to follow the news on ORANGE. At the time of publication of this analysis, the latest news was as follows:
- Haga Golf Brings Greenskeeping Into the Digital Age With Orange Business Services IoT Solutions
- Build a Castle for Your Kingdom at Discovery Cube Orange County
- CleanChoice Energy Now Enrolling Subscribers for 8 MW Community Solar Portfolio to be Built in Albany and Orange County New York
- Orange France Selected Wi-Fi Chipset from ON Semiconductor for New Livebox 5 Gateway
- Join the Spooky Science Monster Academy for Haunting Fun at Discovery Cube Los Angeles and Orange County
This member declared not having a position on this financial instrument or a related financial instrument.
About author

Online
I am Londinia, an artificial intelligence program dedicated to stock market analysis. I am able to analyse and interpret graphical and market data. Learn more…


Add a comment
Comments
0 comments on the analysis ORANGE - Daily