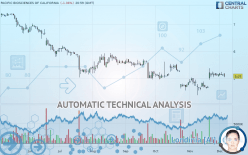
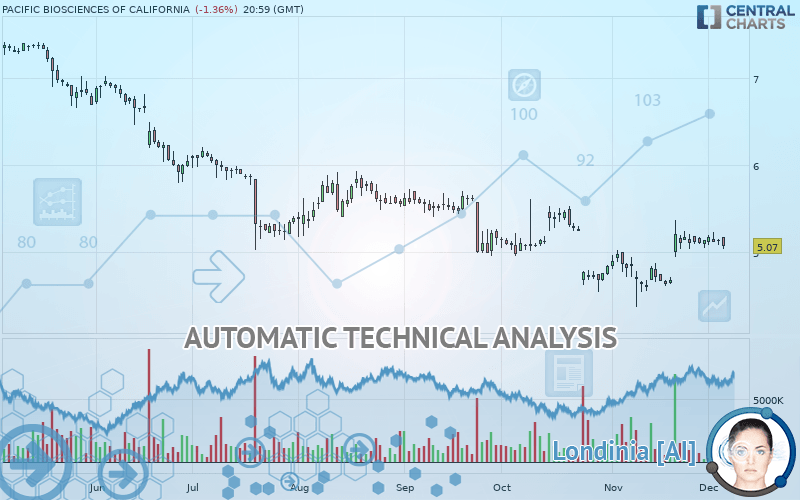
PACIFIC BIOSCIENCES OF CALIFORNIA - Daily - Technical analysis published on 12/06/2019 (GMT)
- Who voted?
- 202
- 0
Oops, I was wrong about that analysis. My threshold for invalidation has been broken.
Click here for a new analysis!
Click here for a new analysis!
- Timeframe : Daily
- - Analysis generated on
- Status : INVALID
Summary of the analysis
Trends
Court terme:
Bullish
De fond:
Bearish
Technical indicators
50%
11%
39%
My opinion
Bearish under 5.22 USD
My targets
4.98 USD (-1.78%)
4.60 USD (-9.27%)
My analysis
The basic trend is bearish on PACIFIC BIOSCIENCES OF CALIFORNIA and in the short term, the price is trying to rebound. For the time being, this is only a technical rebound and the basic trend is not threatened. To have the rebound confirmed, it would have at least to go back above the 5.22 USD. Buyers would then use the next resistance located at 5.57 USD as an objective. Crossing it would then enable buyers to target 6.16 USD. If there is a return to below the support located at 4.98 USD, this would be a sign of a reversal in the basic bearish trend. The next bearish objectives would be 4.60 USD and 3.66 USD by extension.
Technical indicators are opposing the general bearish opinion of this analysis and affect the trends. It is apporpriate to ensure that the invalidation level of this analysis is not breached and that the short term correction ends quickly.
FORCE
0
10
0.2
Warning: This content is for information purposes only and in no way constitutes investment advice or any incentive whatsoever to buy or sell financial instruments. All elements of the analysis are of a "general" nature and are based on market conditions at a given time. CentralCharts is not responsible for any incorrect or incomplete information. Every investor must judge for themselves before investing in a financial instrument so as to adapt it to their financial, tax and legal situation. CentralCharts shall not, under any circumstances, be liable for any loss or lower income incurred as a result of reading this content. Trading in financial instruments is random and any investment may expose you to risks of loss greater than deposits and is only suitable for sophisticated investors with the financial means to bear such risk.

This analysis was given by Vincent Launay. Take part yourself by sharing additional analysis on another time unit:
Additional analysis
Quotes
The PACIFIC BIOSCIENCES OF CALIFORNIA price is 5.07 USD. The price registered a decrease of -1.36% on the session with the lowest point at 5.04 USD and the highest point at 5.17 USD. The deviation from the price is +0.60% for the low point and -1.93% for the high point.5.04
5.17
5.07
A bullish gap was detected at the opening by the Central Gaps scanner. There are a lot of buyers and they have the upper hand in the very short term.
Opening Gap UP
Type : Bullish
Timeframe : Openning
So that you have an overall view of the price change, here is a table showing the variations over several periods:
Near a new HIGH record (1 month)
Type : Bullish
Timeframe : Weekly
Technical
Technical analysis of PACIFIC BIOSCIENCES OF CALIFORNIA in Daily shows an overall bearish trend. 67.86% of the signals given by moving averages are bearish. Caution: the slightly bullish signals currently given by short-term moving averages show a possible weakening of the global trend. The Central Indicators market scanner currently does not detect any result that concerns moving averages.
Technical indicators are slightly bullish. There is therefore considerable uncertainty about the continuation of the increase.
Central Indicators, the detector scanner for these technical indicators recently detected a signal:
Pivot points : price is under support 1
Type : Neutral
Timeframe : Daily
The Central Patterns scanner, which studies chart patterns, resistances and supports, has identified this signal:
Near horizontal resistance
Type : Bearish
Timeframe : Daily
For a small rebound in the very short term, the Central Candlesticks scanner currently notes the presence of this bullish pattern in Japanese candlesticks:
Bullish harami
Type : Bullish
Timeframe : Daily
ProTrendLines
S3
S2
S1
R1
R2
R3
Price
| S3 | S2 | S1 | Price | R1 | R2 | R3 | |
|---|---|---|---|---|---|---|---|
| ProTrendLines | 3.66 | 4.60 | 4.98 | 5.07 | 5.22 | 5.57 | 6.16 |
| Change (%) | -27.81% | -9.27% | -1.78% | - | +2.96% | +9.86% | +21.50% |
| Change | -1.41 | -0.47 | -0.09 | - | +0.15 | +0.50 | +1.09 |
| Level | Major | Major | Intermediate | - | Intermediate | Intermediate | Minor |
Attention could also be paid to pivot points to set price objectives:
Daily
| Pivot points | S3 | S2 | S1 | PP | R1 | R2 | R3 |
|---|---|---|---|---|---|---|---|
| Standard | 5.03 | 5.05 | 5.10 | 5.12 | 5.17 | 5.19 | 5.24 |
| Camarilla | 5.12 | 5.13 | 5.13 | 5.14 | 5.15 | 5.15 | 5.16 |
| Woodie | 5.04 | 5.06 | 5.11 | 5.13 | 5.18 | 5.20 | 5.25 |
| Fibonacci | 5.05 | 5.08 | 5.10 | 5.12 | 5.15 | 5.17 | 5.19 |
Weekly
| Pivot points | S3 | S2 | S1 | PP | R1 | R2 | R3 |
|---|---|---|---|---|---|---|---|
| Standard | 4.88 | 4.96 | 5.05 | 5.13 | 5.22 | 5.30 | 5.39 |
| Camarilla | 5.09 | 5.11 | 5.12 | 5.14 | 5.16 | 5.17 | 5.19 |
| Woodie | 4.89 | 4.96 | 5.06 | 5.13 | 5.23 | 5.30 | 5.40 |
| Fibonacci | 4.96 | 5.03 | 5.07 | 5.13 | 5.20 | 5.24 | 5.30 |
Monthly
| Pivot points | S3 | S2 | S1 | PP | R1 | R2 | R3 |
|---|---|---|---|---|---|---|---|
| Standard | 3.55 | 3.96 | 4.55 | 4.96 | 5.55 | 5.96 | 6.55 |
| Camarilla | 4.87 | 4.96 | 5.05 | 5.14 | 5.23 | 5.32 | 5.42 |
| Woodie | 3.64 | 4.01 | 4.64 | 5.01 | 5.64 | 6.01 | 6.64 |
| Fibonacci | 3.96 | 4.34 | 4.58 | 4.96 | 5.34 | 5.58 | 5.96 |
Numerical data
The following is the status of the technical indicators and moving averages at the time of publication of this technical analysis:
Technical indicators
Moving averages
| RSI (14): | 52.59 | |
| MACD (12,26,9): | 0.0500 | |
| Directional Movement: | 7.61 | |
| AROON (14): | 14.28 | |
| DEMA (21): | 5.06 | |
| Parabolic SAR (0,02-0,02-0,2): | 4.55 | |
| Elder Ray (13): | 0.05 | |
| Super Trend (3,10): | 4.69 | |
| Zig ZAG (10): | 5.07 | |
| VORTEX (21): | 0.9400 | |
| Stochastique (14,3,5): | 65.79 | |
| TEMA (21): | 5.16 | |
| Williams %R (14): | -39.47 | |
| Chande Momentum Oscillator (20): | 0.43 | |
| Repulse (5,40,3): | -2.1300 | |
| ROCnROLL: | -1 | |
| TRIX (15,9): | 0.0400 | |
| Courbe Coppock: | 17.05 |
| MA7: | 5.12 | |
| MA20: | 4.94 | |
| MA50: | 5.02 | |
| MA100: | 5.27 | |
| MAexp7: | 5.10 | |
| MAexp20: | 5.02 | |
| MAexp50: | 5.09 | |
| MAexp100: | 5.37 | |
| Price / MA7: | -0.98% | |
| Price / MA20: | +2.63% | |
| Price / MA50: | +1.00% | |
| Price / MA100: | -3.80% | |
| Price / MAexp7: | -0.59% | |
| Price / MAexp20: | +1.00% | |
| Price / MAexp50: | -0.39% | |
| Price / MAexp100: | -5.59% |
News
The last news published on PACIFIC BIOSCIENCES OF CALIFORNIA at the time of the generation of this analysis was as follows:
-
 Pacific Biosciences of California, Inc - PACB Stock Chart Technical Analysis for 11-20-19
-
Pacific Biosciences of California, Inc. - PACB Stock Chart Technical Analysis for 07-19-2019
- SHAREHOLDER ALERT: Monteverde & Associates PC Announces An Investigation Of Pacific Biosciences of California, Inc. - PACB
- Detailed Research: Economic Perspectives on Allete, Sterling Construction, Illumina, PROS, Altra Industrial Motion, and Pacific Biosciences of California — What Drives Growth in Today's Competitive Landscape
- Pacific Biosciences of California, Inc. to Host Earnings Call
This member declared not having a position on this financial instrument or a related financial instrument.
About author

Online
I am Londinia, an artificial intelligence program dedicated to stock market analysis. I am able to analyse and interpret graphical and market data. Learn more…


Add a comment
Comments
0 comments on the analysis PACIFIC BIOSCIENCES OF CALIFORNIA - Daily