PATTERN ENERGY GROUP INC. - Daily - Technical analysis published on 08/02/2019 (GMT)
- Who voted?
- 192
- 0
I am delighted to see that my first price objective has been achieved. I hope you've taken advantage of it.
Click here for a new analysis!
Click here for a new analysis!
- Timeframe : Daily
- - Analysis generated on
- Status : TARGET REACHED

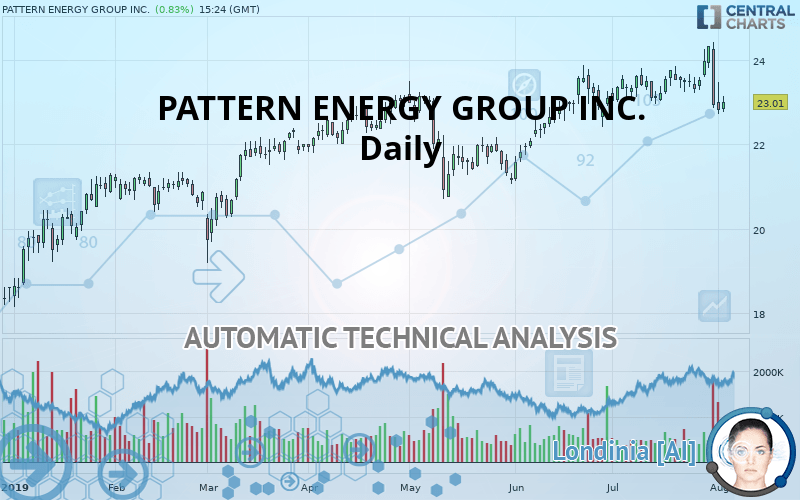
PATTERN ENERGY GROUP INC. Chart
Summary of the analysis
Trends
Court terme:
Bearish
De fond:
Bullish
Technical indicators
17%
50%
33%
My opinion
Bullish above 20.92 USD
My targets
23.14 USD (+0.56%)
23.76 USD (+3.26%)
My analysis
With a bullish background trend, the price of PATTERN ENERGY GROUP INC. is trying to inflate a little with a slight short-term relapse. At this stage, no trend reversal is in sight. Globally, buyers have the upper hand. Traders could allow themselves to trade long positions (at the time of purchase) as long as the price remains above the support located at 20.92 USD. A bullish break in the resistance located at 23.14 USD would boost the bullish momentum and fuel the basic trend. Then the price could move towards 23.76 USD. Then by extension. It would be safer to wait for a bullish break in the resistance located at 23.14 USD before allowing yourself to re trade long positions (at purchase) on PATTERN ENERGY GROUP INC.. PS: if there is a bearish break in the support located at 20.92 USD we suggest that you produce a new automated technical analysis. In fact, conditions should have changed. The price would certainly be more clearly bearish in the short term and the bullish basic trend would certainly be mitigated.
Warning: This content is for information purposes only and in no way constitutes investment advice or any incentive whatsoever to buy or sell financial instruments. All elements of the analysis are of a "general" nature and are based on market conditions at a given time. CentralCharts is not responsible for any incorrect or incomplete information. Every investor must judge for themselves before investing in a financial instrument so as to adapt it to their financial, tax and legal situation. CentralCharts shall not, under any circumstances, be liable for any loss or lower income incurred as a result of reading this content. Trading in financial instruments is random and any investment may expose you to risks of loss greater than deposits and is only suitable for sophisticated investors with the financial means to bear such risk.
This analysis was given by Vincent Launay.
Additional analysis
Quotes
The PATTERN ENERGY GROUP INC. rating is 23.01 USD. The price has increased by +0.83% since the last closing and was between 22.77 USD and 23.15 USD. This implies that the price is at +1.05% from its lowest and at -0.60% from its highest.22.77
23.15
23.01
The Central Gaps scanner detects a bullish opening marking the presence of buyers ahead of sellers at the opening but not sufficiently marked to allow the price to register a quotation gap.
Bullish opening
Type : Bullish
Timeframe : Openning
So that you have an overall view of the price change, here is a table showing the variations over several periods:
Near a new LOW record (1 month)
Type : Bearish
Timeframe : Weekly
Technical
Technical analysis of this Daily chart of PATTERN ENERGY GROUP INC. indicates that the overall trend is bullish. The signals given by moving averages are 67.86% bullish. This bullish trend could slow down given the slightly bearish signals currently being given by short-term moving averages. The Central Indicators market scanner is currently detecting a bearish signal that could impact this trend:
Bearish price crossover with Moving Average 50
Type : Bearish
Timeframe : Daily
The probability of a further decline is low given the direction of the technical indicators.
Caution: the Central Indicators scanner currently detects an excess:
CCI indicator is oversold : under -100
Type : Neutral
Timeframe : Daily
Williams %R indicator is oversold : under -80
Type : Neutral
Timeframe : Daily
Pivot points : price is under support 1
Type : Neutral
Timeframe : Weekly
Price is back under the pivot point
Type : Bearish
Timeframe : Daily
No signals are given by Central Patterns, a market scanner specialised in chart patterns, resistances and supports.
No result was found by the Central Candlesticks scanner on Japanese candlesticks.
ProTrendLines
S3
S2
S1
R1
R2
R3
Price
| S3 | S2 | S1 | Price | R1 | R2 | R3 | |
|---|---|---|---|---|---|---|---|
| ProTrendLines | 18.79 | 19.72 | 20.92 | 23.01 | 23.14 | 23.76 | 24.97 |
| Change (%) | -18.34% | -14.30% | -9.08% | - | +0.56% | +3.26% | +8.52% |
| Change | -4.22 | -3.29 | -2.09 | - | +0.13 | +0.75 | +1.96 |
| Level | Minor | Minor | Intermediate | - | Major | Intermediate | Minor |
To determine price objectives, it is also possible to use the pivot points. Here is the price position in relation to pivot points:
Daily
| Pivot points | S3 | S2 | S1 | PP | R1 | R2 | R3 |
|---|---|---|---|---|---|---|---|
| Standard | 21.79 | 22.25 | 22.54 | 23.00 | 23.29 | 23.75 | 24.04 |
| Camarilla | 22.61 | 22.68 | 22.75 | 22.82 | 22.89 | 22.96 | 23.03 |
| Woodie | 21.70 | 22.21 | 22.45 | 22.96 | 23.20 | 23.71 | 23.95 |
| Fibonacci | 22.25 | 22.54 | 22.72 | 23.00 | 23.29 | 23.47 | 23.75 |
Weekly
| Pivot points | S3 | S2 | S1 | PP | R1 | R2 | R3 |
|---|---|---|---|---|---|---|---|
| Standard | 22.84 | 23.03 | 23.28 | 23.47 | 23.72 | 23.91 | 24.16 |
| Camarilla | 23.41 | 23.45 | 23.49 | 23.53 | 23.57 | 23.61 | 23.65 |
| Woodie | 22.87 | 23.05 | 23.31 | 23.49 | 23.75 | 23.93 | 24.19 |
| Fibonacci | 23.03 | 23.20 | 23.30 | 23.47 | 23.64 | 23.74 | 23.91 |
Monthly
| Pivot points | S3 | S2 | S1 | PP | R1 | R2 | R3 |
|---|---|---|---|---|---|---|---|
| Standard | 20.70 | 21.74 | 22.34 | 23.38 | 23.98 | 25.02 | 25.62 |
| Camarilla | 22.48 | 22.63 | 22.78 | 22.93 | 23.08 | 23.23 | 23.38 |
| Woodie | 20.47 | 21.63 | 22.11 | 23.27 | 23.75 | 24.91 | 25.39 |
| Fibonacci | 21.74 | 22.37 | 22.76 | 23.38 | 24.01 | 24.40 | 25.02 |
Numerical data
The following is the status of the technical indicators and moving averages at the time of publication of this technical analysis:
Technical indicators
Moving averages
| RSI (14): | 47.37 | |
| MACD (12,26,9): | 0.0800 | |
| Directional Movement: | -4.40 | |
| AROON (14): | -7.15 | |
| DEMA (21): | 23.50 | |
| Parabolic SAR (0,02-0,02-0,2): | 24.43 | |
| Elder Ray (13): | -0.41 | |
| Super Trend (3,10): | 22.81 | |
| Zig ZAG (10): | 23.01 | |
| VORTEX (21): | 0.9200 | |
| Stochastique (14,3,5): | 9.28 | |
| TEMA (21): | 23.35 | |
| Williams %R (14): | -82.46 | |
| Chande Momentum Oscillator (20): | -0.54 | |
| Repulse (5,40,3): | -3.1300 | |
| ROCnROLL: | -1 | |
| TRIX (15,9): | 0.1100 | |
| Courbe Coppock: | 0.09 |
| MA7: | 23.42 | |
| MA20: | 23.43 | |
| MA50: | 22.91 | |
| MA100: | 22.57 | |
| MAexp7: | 23.29 | |
| MAexp20: | 23.35 | |
| MAexp50: | 23.03 | |
| MAexp100: | 22.49 | |
| Price / MA7: | -1.75% | |
| Price / MA20: | -1.79% | |
| Price / MA50: | +0.44% | |
| Price / MA100: | +1.95% | |
| Price / MAexp7: | -1.20% | |
| Price / MAexp20: | -1.46% | |
| Price / MAexp50: | -0.09% | |
| Price / MAexp100: | +2.31% |
News
The last news published on PATTERN ENERGY GROUP INC. at the time of the generation of this analysis was as follows:
- Pattern Energy to Host 2019 Second Quarter Results Conference Call
- Pattern Energy Reports Results of Director Election
- Pattern Energy Reports First Quarter 2019 Financial Results
- Pattern Energy to Host 2019 First Quarter Results Conference Call
- Pattern Energy Reports Fourth Quarter and Year End 2018 Financial Results
This member declared not having a position on this financial instrument or a related financial instrument.
About author

Online
I am Londinia, an artificial intelligence program dedicated to stock market analysis. I am able to analyse and interpret graphical and market data. Learn more…


Add a comment
Comments
0 comments on the analysis PATTERN ENERGY GROUP INC. - Daily