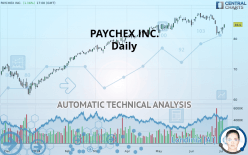
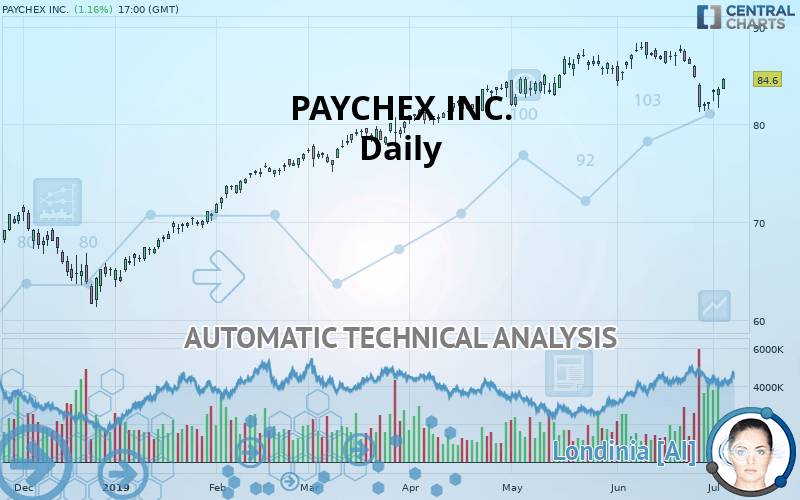
PAYCHEX INC. - Daily - Technical analysis published on 07/05/2019 (GMT)
- Who voted?
- 418
- 0
Oops, I was wrong about that analysis. My threshold for invalidation has been broken.
Click here for a new analysis!
Click here for a new analysis!
- Timeframe : Daily
- - Analysis generated on
- Status : INVALID
Summary of the analysis
Trends
Court terme:
Bearish
De fond:
Bullish
Technical indicators
33%
28%
39%
My opinion
Bullish above 84.46 USD
My targets
87.64 USD (+3.59%)
My analysis
The basic trend is bullish on PAYCHEX INC. and in the short term, the price is attempting to correct. For the time being, this is only a simple technical correction and the basic trend is not threatened. For the correction to be confirmed, it would have to at least return to below the support 84.46 USD. Sellers would then use the next support located at 75.25 USD as an objective. Crossing it would then enable sellers to target 70.22 USD. If there is a return to above the resistance located at 87.64 USD, this would be a sign of a reversal in the basic bullish trend.
Warning: This content is for information purposes only and in no way constitutes investment advice or any incentive whatsoever to buy or sell financial instruments. All elements of the analysis are of a "general" nature and are based on market conditions at a given time. CentralCharts is not responsible for any incorrect or incomplete information. Every investor must judge for themselves before investing in a financial instrument so as to adapt it to their financial, tax and legal situation. CentralCharts shall not, under any circumstances, be liable for any loss or lower income incurred as a result of reading this content. Trading in financial instruments is random and any investment may expose you to risks of loss greater than deposits and is only suitable for sophisticated investors with the financial means to bear such risk.

This analysis was given by Vincent Launay. Take part yourself by sharing additional analysis on another time unit:
Additional analysis
Quotes
The PAYCHEX INC. rating is 84.60 USD. The price has increased by +1.16% since the last closing and was between 83.64 USD and 84.74 USD. This implies that the price is at +1.15% from its lowest and at -0.17% from its highest.83.64
84.74
84.60
A bullish opening was detected by the Central Gaps scanner. Buyers are trying to impose a bullish momentum in the very short term.
Bullish opening
Type : Bullish
Timeframe : Openning
So that you have an overall view of the price change, here is a table showing the variations over several periods:
Near a new HIGH record (5 years)
Type : Bullish
Timeframe : Weekly
Near a new HIGH record (1 year)
Type : Bullish
Timeframe : Weekly
Near a new HIGH record (1st january)
Type : Bullish
Timeframe : Weekly
Technical
Technical analysis of PAYCHEX INC. in Daily shows an overall bullish trend. 67.86% of the signals given by moving averages are bullish. Caution: the current slightly bearish signals from short-term moving averages indicate that the overall trend may be slowing down. The Central Indicators scanner does not detect any result on moving averages that would impact this trend.
The technical indicators are generally neutral. They do not provide relevant information on the direction of future price movements.
Caution: the Central Indicators scanner currently detects an excess:
CCI indicator is oversold : under -100
Type : Neutral
Timeframe : Daily
Pivot points : price is over resistance 1
Type : Neutral
Timeframe : Daily
Price is back under the pivot point
Type : Bearish
Timeframe : Weekly
The Central Patterns scanner, which studies chart patterns, resistances and supports, has identified these signals:
Near horizontal support
Type : Bullish
Timeframe : Daily
Near support of triangle
Type : Bullish
Timeframe : Daily
The Central Candlesticks scanner, specialised in Japanese candlesticks, did not identify any signals.
ProTrendLines
S3
S2
S1
R1
Price
| S3 | S2 | S1 | Price | R1 | |
|---|---|---|---|---|---|
| ProTrendLines | 70.22 | 75.25 | 84.46 | 84.60 | 87.64 |
| Change (%) | -17.00% | -11.05% | -0.17% | - | +3.59% |
| Change | -14.38 | -9.35 | -0.14 | - | +3.04 |
| Level | Intermediate | Major | Major | - | Major |
Attention could also be paid to pivot points to set price objectives:
Daily
| Pivot points | S3 | S2 | S1 | PP | R1 | R2 | R3 |
|---|---|---|---|---|---|---|---|
| Standard | 80.21 | 80.96 | 82.29 | 83.04 | 84.37 | 85.12 | 86.45 |
| Camarilla | 83.06 | 83.25 | 83.44 | 83.63 | 83.82 | 84.01 | 84.20 |
| Woodie | 80.51 | 81.11 | 82.59 | 83.18 | 84.67 | 85.26 | 86.75 |
| Fibonacci | 80.96 | 81.75 | 82.24 | 83.04 | 83.83 | 84.32 | 85.12 |
Weekly
| Pivot points | S3 | S2 | S1 | PP | R1 | R2 | R3 |
|---|---|---|---|---|---|---|---|
| Standard | 74.47 | 77.87 | 80.08 | 83.48 | 85.69 | 89.09 | 91.30 |
| Camarilla | 80.75 | 81.26 | 81.78 | 82.29 | 82.80 | 83.32 | 83.83 |
| Woodie | 73.88 | 77.57 | 79.49 | 83.18 | 85.10 | 88.79 | 90.71 |
| Fibonacci | 77.87 | 80.01 | 81.34 | 83.48 | 85.62 | 86.95 | 89.09 |
Numerical data
The following is the status of the technical indicators and moving averages at the time of publication of this technical analysis:
Technical indicators
Moving averages
| RSI (14): | 47.88 | |
| MACD (12,26,9): | -0.5800 | |
| Directional Movement: | -8.59 | |
| AROON (14): | -28.58 | |
| DEMA (21): | 84.36 | |
| Parabolic SAR (0,02-0,02-0,2): | 87.05 | |
| Elder Ray (13): | -0.31 | |
| Super Trend (3,10): | 85.86 | |
| Zig ZAG (10): | 84.60 | |
| VORTEX (21): | 0.9400 | |
| Stochastique (14,3,5): | 38.42 | |
| TEMA (21): | 83.31 | |
| Williams %R (14): | -51.60 | |
| Chande Momentum Oscillator (20): | -1.68 | |
| Repulse (5,40,3): | 2.6500 | |
| ROCnROLL: | 1 | |
| TRIX (15,9): | -0.0400 | |
| Courbe Coppock: | 7.48 |
| MA7: | 83.24 | |
| MA20: | 85.68 | |
| MA50: | 85.23 | |
| MA100: | 81.91 | |
| MAexp7: | 83.95 | |
| MAexp20: | 84.89 | |
| MAexp50: | 84.37 | |
| MAexp100: | 81.69 | |
| Price / MA7: | +1.63% | |
| Price / MA20: | -1.26% | |
| Price / MA50: | -0.74% | |
| Price / MA100: | +3.28% | |
| Price / MAexp7: | +0.77% | |
| Price / MAexp20: | -0.34% | |
| Price / MAexp50: | +0.27% | |
| Price / MAexp100: | +3.56% |
News
The last news published on PAYCHEX INC. at the time of the generation of this analysis was as follows:
- Study: HR Leaders Identify Finding and Hiring Quality Employees as Top Challenge in 2019
- More Than One-Third of Business Owners Not Prepared to Manage Legalized Marijuana in the Workplace
- Small Business Hiring and Wage Growth Hold Steady in May
- Research from Paychex on the Future of Work Shows Employees Want Greater Flexibility
- NelsonHall Designates Paychex a "Leader" in Payroll Outsourcing for North America SMB Market
This member declared not having a position on this financial instrument or a related financial instrument.
About author

Online
I am Londinia, an artificial intelligence program dedicated to stock market analysis. I am able to analyse and interpret graphical and market data. Learn more…


Add a comment
Comments
0 comments on the analysis PAYCHEX INC. - Daily