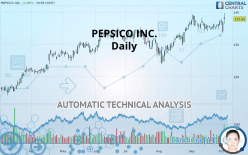
PEPSICO INC. - Daily - Technical analysis published on 10/04/2019 (GMT)
- Who voted?
- 318
- 0
Click here for a new analysis!
- Timeframe : Daily
- - Analysis generated on
- Status : TARGET REACHED

Summary of the analysis

Additional analysis
Quotes
The PEPSICO INC. price is 137.93 USD. On the day, this instrument gained +2.98% with the lowest point at 136.50 USD and the highest point at 139.75 USD. The deviation from the price is +1.05% for the low point and -1.30% for the high point.The Central Gaps scanner detects a bullish gap which is a sign that buyers have taken the lead in the very short term.
Opening Gap UP
Type : Bullish
Timeframe : Openning
A study of price movements over other periods shows the following variations:
New HIGH record (5 years)
Type : Bullish
Timeframe : Weekly
New HIGH record (1 year)
Type : Bullish
Timeframe : Weekly
New HIGH record (1st january)
Type : Bullish
Timeframe : Weekly
New HIGH record (1 month)
Type : Bullish
Timeframe : Weekly
Near a new LOW record (1 month)
Type : Bearish
Timeframe : Weekly
Technical
A technical analysis in Daily of this PEPSICO INC. chart shows a strongly bullish trend. 92.86% of the signals given by moving averages are bullish. This strongly bullish trend is supported by the strong bullish signals given by short-term moving averages. An assessment of moving averages reveals several bearish signals that could impact this trend:
Bearish price crossover with Moving Average 20
Type : Bearish
Timeframe : Daily
Bearish price crossover with adaptative moving average 20
Type : Bearish
Timeframe : Daily
In fact, Central Analyzer took into account 18 technical indicators and the result was as follows: 10 are bullish, 4 are neutral and 4 are bearish. But beware of excesses. The Central Indicators scanner currently detects this:
RSI indicator: bearish divergence
Type : Bearish
Timeframe : Daily
Williams %R indicator is oversold : under -80
Type : Neutral
Timeframe : Daily
Williams %R indicator is overbought : over -20
Type : Neutral
Timeframe : Daily
Pivot points : price is over resistance 1
Type : Neutral
Timeframe : Daily
Pivot points : price is over resistance 2
Type : Neutral
Timeframe : Weekly
RSI indicator is back under 50
Type : Bearish
Timeframe : Daily
Parabolic SAR indicator bearish reversal
Type : Bearish
Timeframe : Daily
Ichimoku - Bearish crossover : Tenkan & Kijun
Type : Bearish
Timeframe : Daily
Price is back under the pivot point
Type : Bearish
Timeframe : Daily
Momentum indicator is back under 0
Type : Bearish
Timeframe : Daily
Williams %R indicator is back under -50
Type : Bearish
Timeframe : Daily
An analysis of the price chart with the Central Patterns scanner (detector of chart patterns and resistances and supports) shows a result that can have an impact on the price change:
Horizontal resistance is broken
Type : Bullish
Timeframe : Daily
The Central Candlesticks scanner, specialised in Japanese candlesticks, did not identify any signals.
| S3 | S2 | S1 | Price | R1 | |
|---|---|---|---|---|---|
| ProTrendLines | 121.80 | 124.40 | 134.41 | 137.93 | 139.15 |
| Change (%) | -11.69% | -9.81% | -2.55% | - | +0.88% |
| Change | -16.13 | -13.53 | -3.52 | - | +1.22 |
| Level | Major | Minor | Major | - | Major |
To determine price objectives, it is also possible to use the pivot points. Here is the price position in relation to pivot points:
| Pivot points | S3 | S2 | S1 | PP | R1 | R2 | R3 |
|---|---|---|---|---|---|---|---|
| Standard | 128.60 | 131.04 | 132.49 | 134.94 | 136.39 | 138.83 | 140.28 |
| Camarilla | 132.87 | 133.23 | 133.58 | 133.94 | 134.30 | 134.65 | 135.01 |
| Woodie | 128.10 | 130.79 | 131.99 | 134.69 | 135.89 | 138.58 | 139.78 |
| Fibonacci | 131.04 | 132.53 | 133.45 | 134.94 | 136.42 | 137.34 | 138.83 |
| Pivot points | S3 | S2 | S1 | PP | R1 | R2 | R3 |
|---|---|---|---|---|---|---|---|
| Standard | 132.66 | 133.58 | 134.59 | 135.52 | 136.53 | 137.45 | 138.46 |
| Camarilla | 135.07 | 135.25 | 135.42 | 135.60 | 135.78 | 135.96 | 136.13 |
| Woodie | 132.70 | 133.60 | 134.63 | 135.54 | 136.57 | 137.47 | 138.50 |
| Fibonacci | 133.58 | 134.32 | 134.78 | 135.52 | 136.26 | 136.71 | 137.45 |
| Pivot points | S3 | S2 | S1 | PP | R1 | R2 | R3 |
|---|---|---|---|---|---|---|---|
| Standard | 129.33 | 131.71 | 134.41 | 136.79 | 139.49 | 141.87 | 144.57 |
| Camarilla | 135.70 | 136.17 | 136.63 | 137.10 | 137.57 | 138.03 | 138.50 |
| Woodie | 129.48 | 131.79 | 134.56 | 136.87 | 139.64 | 141.95 | 144.72 |
| Fibonacci | 131.71 | 133.65 | 134.85 | 136.79 | 138.73 | 139.93 | 141.87 |
Numerical data
The following is the status of technical indicators and moving averages registered at the time this technical analysis was created:
| RSI (14): | 58.35 | |
| MACD (12,26,9): | 0.6600 | |
| Directional Movement: | 4.45 | |
| AROON (14): | 7.14 | |
| DEMA (21): | 136.66 | |
| Parabolic SAR (0,02-0,02-0,2): | 133.49 | |
| Elder Ray (13): | 2.13 | |
| Super Trend (3,10): | 132.19 | |
| Zig ZAG (10): | 137.93 | |
| VORTEX (21): | 0.8700 | |
| Stochastique (14,3,5): | 53.07 | |
| TEMA (21): | 136.45 | |
| Williams %R (14): | -29.05 | |
| Chande Momentum Oscillator (20): | 2.23 | |
| Repulse (5,40,3): | -1.9900 | |
| ROCnROLL: | 1 | |
| TRIX (15,9): | 0.0800 | |
| Courbe Coppock: | 0.31 |
| MA7: | 136.11 | |
| MA20: | 135.98 | |
| MA50: | 133.20 | |
| MA100: | 132.39 | |
| MAexp7: | 136.24 | |
| MAexp20: | 135.69 | |
| MAexp50: | 134.14 | |
| MAexp100: | 131.53 | |
| Price / MA7: | +1.34% | |
| Price / MA20: | +1.43% | |
| Price / MA50: | +3.55% | |
| Price / MA100: | +4.18% | |
| Price / MAexp7: | +1.24% | |
| Price / MAexp20: | +1.65% | |
| Price / MAexp50: | +2.83% | |
| Price / MAexp100: | +4.87% |
News
The last news published on PEPSICO INC. at the time of the generation of this analysis was as follows:
- Families, Invent Away! Frito-Lay Announces Return of "Dreamvention" to Find the Next Best Invention Idea
-
 Tesla Shares Pop After Pepsi Places Order For Electric Semi Trucks | CNBC
-
Pepsi moving stock listing to Nasdaq
- PepsiCo, Inc. to Move Stock Exchange Listing to Nasdaq
- PepsiCo Announces Timing and Availability of Fourth Quarter and Full Year 2017 Financial Results and Conference Call
About author

Online


Add a comment
Comments
0 comments on the analysis PEPSICO INC. - Daily