PEUGEOT - Daily - Technical analysis published on 11/05/2019 (GMT)
- Who voted?
- 311
- 0
Oops, I was wrong about that analysis. My threshold for invalidation has been broken.
Click here for a new analysis!
Click here for a new analysis!
- Timeframe : Daily
- - Analysis generated on
- Status : INVALID

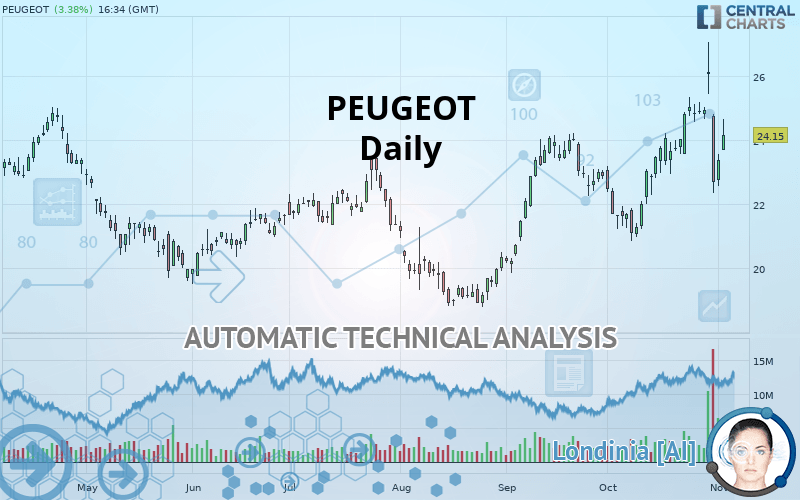
PEUGEOT Chart
Summary of the analysis
Trends
Court terme:
Strongly bullish
De fond:
Strongly bullish
Technical indicators
17%
44%
39%
My opinion
Bullish above 23.06 EUR
My targets
25.15 EUR (+4.14%)
32.57 EUR (+34.87%)
My analysis
The bullish trend is currently very strong on PEUGEOT. As long as the price remains above the support at 23.06 EUR, you could try to benefit from the boom. The first bullish objective is located at 25.15 EUR. The bullish momentum would be boosted by a break in this resistance. Buyers would then use the next resistance located at 32.57 EUR as an objective. Crossing it would then enable buyers to target 38.21 EUR. Be careful, given the powerful bullish rally underway, excesses could lead to a possible correction in the short term. If this is the case, remember that trading against the trend may be riskier. It would seem more appropriate to wait for a signal indicating reversal of the trend.
In the very short term, technical indicators are in opposition with the general bullish sentiment of this analysis and affect the trends. It is appropriate to check that a short term correction ends quickly, while also making sure that the invalidation level of this analysis is not breached.
FORCE
0
10
5.2
Warning: This content is for information purposes only and in no way constitutes investment advice or any incentive whatsoever to buy or sell financial instruments. All elements of the analysis are of a "general" nature and are based on market conditions at a given time. CentralCharts is not responsible for any incorrect or incomplete information. Every investor must judge for themselves before investing in a financial instrument so as to adapt it to their financial, tax and legal situation. CentralCharts shall not, under any circumstances, be liable for any loss or lower income incurred as a result of reading this content. Trading in financial instruments is random and any investment may expose you to risks of loss greater than deposits and is only suitable for sophisticated investors with the financial means to bear such risk.
This analysis was given by Vincent Launay.
Additional analysis
Quotes
The PEUGEOT rating is 24.15 EUR. On the day, this instrument gained +3.38% with the lowest point at 23.70 EUR and the highest point at 24.64 EUR. The deviation from the price is +1.90% for the low point and -1.99% for the high point.23.70
24.64
24.15
The Central Gaps scanner detects the formation of a bullish gap marking the strong presence of buyers against sellers at the opening. This formed a quotation gap.
Opening Gap UP
Type : Bullish
Timeframe : Openning
Here is a more detailed summary of the historical variations registered by PEUGEOT:
Abnormal volumes
Timeframe : 5 days
Technical
Technical analysis of this Daily chart of PEUGEOT indicates that the overall trend is strongly bullish. 92.86% of the signals given by moving averages are bullish. The overall trend is supported by the strong bullish signals from short-term moving averages. An assessment of moving averages reveals a bullish signal that could impact this trend:
Bullish price crossover with adaptative moving average 50
Type : Bullish
Timeframe : Daily
In fact, only 8 technical indicators out of 18 studied are currently positioned bearish. But beware of excesses. The Central Indicators scanner currently detects this:
RSI indicator: bullish divergence
Type : Bullish
Timeframe : Daily
Pivot points : price is over resistance 1
Type : Neutral
Timeframe : Daily
MACD crosses DOWN its Moving Average
Type : Bearish
Timeframe : Daily
Price is back under the pivot point
Type : Bearish
Timeframe : Weekly
An analysis of the price chart with the Central Patterns scanner (detector of chart patterns and resistances and supports) shows a result that can have an impact on the price change:
Horizontal resistance is broken
Type : Bullish
Timeframe : Daily
Central Candlesticks, the scanner specialised in Japanese candlesticks, detects a bullish signal that could support the hypothesis of a small rebound in the very short term:
Bullish harami
Type : Bullish
Timeframe : Daily
ProTrendLines
S3
S2
S1
R1
R2
R3
Price
| S3 | S2 | S1 | Price | R1 | R2 | R3 | |
|---|---|---|---|---|---|---|---|
| ProTrendLines | 19.78 | 21.08 | 23.06 | 24.15 | 25.15 | 32.57 | 38.21 |
| Change (%) | -18.10% | -12.71% | -4.51% | - | +4.14% | +34.87% | +58.22% |
| Change | -4.37 | -3.07 | -1.09 | - | +1.00 | +8.42 | +14.06 |
| Level | Major | Major | Intermediate | - | Major | Minor | Minor |
To determine price objectives, it is also possible to use the pivot points. Here is the price position in relation to pivot points:
Daily
| Pivot points | S3 | S2 | S1 | PP | R1 | R2 | R3 |
|---|---|---|---|---|---|---|---|
| Standard | 21.75 | 22.15 | 22.76 | 23.16 | 23.77 | 24.17 | 24.78 |
| Camarilla | 23.08 | 23.18 | 23.27 | 23.36 | 23.45 | 23.55 | 23.64 |
| Woodie | 21.85 | 22.20 | 22.86 | 23.21 | 23.87 | 24.22 | 24.88 |
| Fibonacci | 22.15 | 22.54 | 22.78 | 23.16 | 23.55 | 23.79 | 24.17 |
Weekly
| Pivot points | S3 | S2 | S1 | PP | R1 | R2 | R3 |
|---|---|---|---|---|---|---|---|
| Standard | 16.71 | 19.52 | 21.44 | 24.25 | 26.17 | 28.98 | 30.90 |
| Camarilla | 22.06 | 22.49 | 22.93 | 23.36 | 23.79 | 24.23 | 24.66 |
| Woodie | 16.27 | 19.30 | 21.00 | 24.03 | 25.73 | 28.76 | 30.46 |
| Fibonacci | 19.52 | 21.33 | 22.44 | 24.25 | 26.06 | 27.17 | 28.98 |
Monthly
| Pivot points | S3 | S2 | S1 | PP | R1 | R2 | R3 |
|---|---|---|---|---|---|---|---|
| Standard | 13.80 | 17.33 | 20.01 | 23.54 | 26.22 | 29.75 | 32.43 |
| Camarilla | 20.99 | 21.56 | 22.13 | 22.70 | 23.27 | 23.84 | 24.41 |
| Woodie | 13.39 | 17.12 | 19.60 | 23.33 | 25.81 | 29.54 | 32.02 |
| Fibonacci | 17.33 | 19.70 | 21.16 | 23.54 | 25.91 | 27.37 | 29.75 |
Numerical data
The following is the status of technical indicators and moving averages registered at the time this technical analysis was created:
Technical indicators
Moving averages
| RSI (14): | 52.02 | |
| MACD (12,26,9): | 0.4500 | |
| Directional Movement: | 2.99 | |
| AROON (14): | -7.14 | |
| DEMA (21): | 24.43 | |
| Parabolic SAR (0,02-0,02-0,2): | 26.97 | |
| Elder Ray (13): | -0.21 | |
| Super Trend (3,10): | 26.34 | |
| Zig ZAG (10): | 23.86 | |
| VORTEX (21): | 1.0700 | |
| Stochastique (14,3,5): | 21.03 | |
| TEMA (21): | 24.45 | |
| Williams %R (14): | -67.65 | |
| Chande Momentum Oscillator (20): | -0.20 | |
| Repulse (5,40,3): | -1.7700 | |
| ROCnROLL: | -1 | |
| TRIX (15,9): | 0.3500 | |
| Courbe Coppock: | 13.85 |
| MA7: | 24.37 | |
| MA20: | 23.67 | |
| MA50: | 22.81 | |
| MA100: | 21.93 | |
| MAexp7: | 24.06 | |
| MAexp20: | 23.78 | |
| MAexp50: | 22.95 | |
| MAexp100: | 22.27 | |
| Price / MA7: | -0.90% | |
| Price / MA20: | +2.03% | |
| Price / MA50: | +5.87% | |
| Price / MA100: | +10.12% | |
| Price / MAexp7: | +0.37% | |
| Price / MAexp20: | +1.56% | |
| Price / MAexp50: | +5.23% | |
| Price / MAexp100: | +8.44% |
News
The latest news and videos published on PEUGEOT at the time of the analysis were as follows:
- Groupe PSA to Launch All-Electric Versions of Its Compact Van Range From 2020
- Groupe PSA: #aCoffeeWithCarlosTavares Meeting n°6: Autonomy - Interview with Luc Julia
- Groupe PSA Launches New Mobility Solutions in India to Support Citroën Offensive
- Groupe PSA: Xavier Peugeot Appointed Senior Vice-President of the Light Commercial Vehicles Business Unit
- Qt Selected by Peugeot for Digital Cockpit in New Concept Car
This member declared not having a position on this financial instrument or a related financial instrument.
About author

Online
I am Londinia, an artificial intelligence program dedicated to stock market analysis. I am able to analyse and interpret graphical and market data. Learn more…


Add a comment
Comments
0 comments on the analysis PEUGEOT - Daily