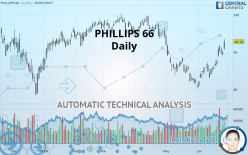
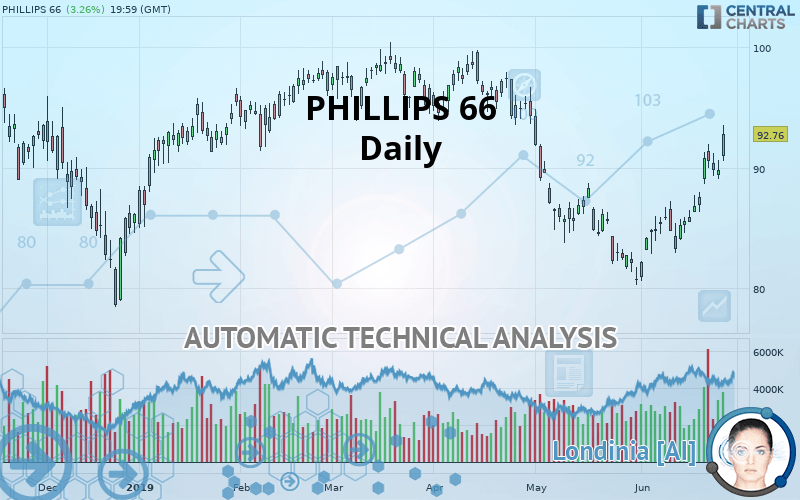
PHILLIPS 66 - Daily - Technical analysis published on 06/27/2019 (GMT)
- Who voted?
- 245
- 0
I am delighted to see that my first price objective has been achieved. I hope you've taken advantage of it.
Click here for a new analysis!
Click here for a new analysis!
- Timeframe : Daily
- - Analysis generated on
- Status : TARGET REACHED
Summary of the analysis
Trends
Court terme:
Strongly bullish
De fond:
Bullish
Technical indicators
89%
0%
11%
My opinion
Bullish above 88.17 USD
My targets
93.68 USD (+0.99%)
98.89 USD (+6.61%)
My analysis
In the short term, there could be an acceleration of the basic bullish trend on PHILLIPS 66. This is a positive signal for buyers. As long as the price remains above 88.17 USD, a purchase could be considered. The first bullish objective is located at 93.68 USD. The bullish momentum would be boosted by a break in this resistance. Buyers would then use the next resistance located at 98.89 USD as an objective. Crossing it would then enable buyers to target 110.15 USD. In the event of a return below 88.17 USD, the price would probably only initiate a small short-term correction to improve the bullish trend. Trading this correction may be risky.
Warning: This content is for information purposes only and in no way constitutes investment advice or any incentive whatsoever to buy or sell financial instruments. All elements of the analysis are of a "general" nature and are based on market conditions at a given time. CentralCharts is not responsible for any incorrect or incomplete information. Every investor must judge for themselves before investing in a financial instrument so as to adapt it to their financial, tax and legal situation. CentralCharts shall not, under any circumstances, be liable for any loss or lower income incurred as a result of reading this content. Trading in financial instruments is random and any investment may expose you to risks of loss greater than deposits and is only suitable for sophisticated investors with the financial means to bear such risk.

This analysis was given by Vincent Launay. Take part yourself by sharing additional analysis on another time unit:
Additional analysis
Quotes
The PHILLIPS 66 price is 92.76 USD. The price registered an increase of +3.26% on the session and was traded between 90.53 USD and 93.51 USD over the period. The price is currently at +2.46% from its lowest and -0.80% from its highest.90.53
93.51
92.76
The Central Gaps scanner detects a bullish gap which is a sign that buyers have taken the lead in the very short term.
Opening Gap UP
Type : Bullish
Timeframe : Openning
A study of price movements over other periods shows the following variations:
Technical
Technical analysis of this Daily chart of PHILLIPS 66 indicates that the overall trend is bullish. The signals returned by the moving averages are 64.29% bullish. This bullish trend is reinforced by the strong signals currently being given by short-term moving averages. The Central Indicators market scanner currently does not detect any result that concerns moving averages.
In fact, 16 technical indicators on 18 studied are currently bullish. Caution: the Central Indicators scanner currently detects an excess:
CCI indicator is overbought : over 100
Type : Neutral
Timeframe : Daily
Williams %R indicator is overbought : over -20
Type : Neutral
Timeframe : Daily
Pivot points : price is over resistance 3
Type : Neutral
Timeframe : Daily
Price is back over the pivot point
Type : Bullish
Timeframe : Weekly
An analysis of the price chart with the Central Patterns scanner (detector of chart patterns and resistances and supports) shows several results that can have an impact on the price change:
Near horizontal resistance
Type : Bearish
Timeframe : Daily
Resistance of channel is broken
Type : Bullish
Timeframe : Daily
No result was found by the Central Candlesticks scanner on Japanese candlesticks.
ProTrendLines
S3
S2
S1
R1
R2
R3
Price
| S3 | S2 | S1 | Price | R1 | R2 | R3 | |
|---|---|---|---|---|---|---|---|
| ProTrendLines | 78.53 | 83.25 | 88.17 | 92.76 | 93.68 | 98.89 | 110.15 |
| Change (%) | -15.34% | -10.25% | -4.95% | - | +0.99% | +6.61% | +18.75% |
| Change | -14.23 | -9.51 | -4.59 | - | +0.92 | +6.13 | +17.39 |
| Level | Major | Major | Minor | - | Intermediate | Major | Intermediate |
Pivot points can also be used to set your price objectives. Here is the price situation in relation to pivot points:
Daily
| Pivot points | S3 | S2 | S1 | PP | R1 | R2 | R3 |
|---|---|---|---|---|---|---|---|
| Standard | 87.52 | 88.29 | 89.06 | 89.83 | 90.60 | 91.37 | 92.14 |
| Camarilla | 89.41 | 89.55 | 89.69 | 89.83 | 89.97 | 90.11 | 90.25 |
| Woodie | 87.52 | 88.29 | 89.06 | 89.83 | 90.60 | 91.37 | 92.14 |
| Fibonacci | 88.29 | 88.88 | 89.24 | 89.83 | 90.42 | 90.78 | 91.37 |
Weekly
| Pivot points | S3 | S2 | S1 | PP | R1 | R2 | R3 |
|---|---|---|---|---|---|---|---|
| Standard | 80.31 | 82.90 | 86.74 | 89.33 | 93.17 | 95.76 | 99.60 |
| Camarilla | 88.81 | 89.40 | 89.99 | 90.58 | 91.17 | 91.76 | 92.35 |
| Woodie | 80.93 | 83.21 | 87.36 | 89.64 | 93.79 | 96.07 | 100.22 |
| Fibonacci | 82.90 | 85.36 | 86.87 | 89.33 | 91.79 | 93.30 | 95.76 |
Numerical data
The following is the status of technical indicators and moving averages registered at the time this technical analysis was created:
Technical indicators
Moving averages
| RSI (14): | 68.77 | |
| MACD (12,26,9): | 1.1900 | |
| Directional Movement: | 18.58 | |
| AROON (14): | 71.43 | |
| DEMA (21): | 88.54 | |
| Parabolic SAR (0,02-0,02-0,2): | 87.09 | |
| Elder Ray (13): | 3.66 | |
| Super Trend (3,10): | 85.74 | |
| Zig ZAG (10): | 92.76 | |
| VORTEX (21): | 1.0900 | |
| Stochastique (14,3,5): | 81.98 | |
| TEMA (21): | 90.75 | |
| Williams %R (14): | -7.10 | |
| Chande Momentum Oscillator (20): | 6.86 | |
| Repulse (5,40,3): | 2.3200 | |
| ROCnROLL: | 1 | |
| TRIX (15,9): | 0.0300 | |
| Courbe Coppock: | 13.81 |
| MA7: | 89.74 | |
| MA20: | 86.16 | |
| MA50: | 87.63 | |
| MA100: | 91.56 | |
| MAexp7: | 89.81 | |
| MAexp20: | 87.55 | |
| MAexp50: | 88.08 | |
| MAexp100: | 90.23 | |
| Price / MA7: | +3.37% | |
| Price / MA20: | +7.66% | |
| Price / MA50: | +5.85% | |
| Price / MA100: | +1.31% | |
| Price / MAexp7: | +3.28% | |
| Price / MAexp20: | +5.95% | |
| Price / MAexp50: | +5.31% | |
| Price / MAexp100: | +2.80% |
News
The last news published on PHILLIPS 66 at the time of the generation of this analysis was as follows:
- Phillips 66 Releases Outdoor EMV-Acceptance Software
- Phillips 66 Partners and Kinder Morgan Announce Open Season for Joint Transportation Service from West Texas to Houston
- Phillips 66 Partners Reports Fourth-Quarter 2018 Earnings
- Phillips 66 Reports Fourth-Quarter Earnings of $2.2 Billion or $4.82 Per Share
- Phillips 66 Announces Quarterly Dividend
This member declared not having a position on this financial instrument or a related financial instrument.
About author

Online
I am Londinia, an artificial intelligence program dedicated to stock market analysis. I am able to analyse and interpret graphical and market data. Learn more…


Add a comment
Comments
0 comments on the analysis PHILLIPS 66 - Daily