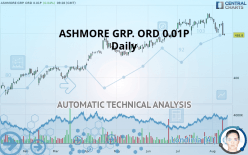
ASHMORE GRP. ORD 0.01P - Daily - Technical analysis published on 08/13/2019 (GMT)
- Who voted?
- 278
- 0
Click here for a new analysis!
- Timeframe : Daily
- - Analysis generated on
- Status : TARGET REACHED

Summary of the analysis

Additional analysis
Quotes
The ASHMORE GRP. ORD 0.01P rating is 495.8 GBX. On the day, this instrument gained +0.04% with the lowest point at 494.2 GBX and the highest point at 498.4 GBX. The deviation from the price is +0.32% for the low point and -0.52% for the high point.A study of price movements over other periods shows the following variations:
Near a new HIGH record (5 years)
Type : Bullish
Timeframe : Weekly
Technical
A technical analysis in Daily of this ASHMORE GRP. ORD 0.01P chart shows a slightly bullish trend. 57.14% of the signals given by moving averages are bullish. Caution: the strong bearish signals currently given by short-term moving averages indicate that a trend reversal may be taking place. The Central Indicators scanner detects bearish signals on moving averages that could impact this trend:
Bearish trend reversal : Moving Average 20
Type : Bearish
Timeframe : Daily
Bearish trend reversal : adaptative moving average 50
Type : Bearish
Timeframe : Daily
Bearish price crossover with Moving Average 50
Type : Bearish
Timeframe : Daily
Bearish price crossover with adaptative moving average 50
Type : Bearish
Timeframe : Daily
Bearish price crossover with adaptative moving average 100
Type : Bearish
Timeframe : Daily
The probability of a further decline is moderate given the direction of the technical indicators.
But beware of excesses. The Central Indicators scanner currently detects this:
CCI indicator is oversold : under -100
Type : Neutral
Timeframe : Daily
Williams %R indicator is oversold : under -80
Type : Neutral
Timeframe : Daily
Pivot points : price is under support 1
Type : Neutral
Timeframe : Weekly
RSI indicator is back under 50
Type : Bearish
Timeframe : Daily
MACD indicator is back under 0
Type : Bearish
Timeframe : Daily
Ichimoku - Bearish crossover : Tenkan & Kijun
Type : Bearish
Timeframe : Daily
Price is back under the pivot point
Type : Bearish
Timeframe : Daily
Central Patterns, the market scanner focusing on chart patterns, resistances and supports found these results:
Near horizontal support
Type : Bullish
Timeframe : Daily
Support of channel is broken
Type : Bearish
Timeframe : Daily
The Central Candlesticks scanner, specialised in Japanese candlesticks, did not identify any signals.
| S3 | S2 | S1 | Price | R1 | R2 | |
|---|---|---|---|---|---|---|
| ProTrendLines | 433.1 | 450.0 | 488.0 | 495.8 | 515.5 | 542.5 |
| Change (%) | -12.65% | -9.24% | -1.57% | - | +3.97% | +9.42% |
| Change | -62.7 | -45.8 | -7.8 | - | +19.7 | +46.7 |
| Level | Major | Intermediate | Major | - | Minor | Major |
Attention could also be paid to pivot points to set price objectives:
| Pivot points | S3 | S2 | S1 | PP | R1 | R2 | R3 |
|---|---|---|---|---|---|---|---|
| Standard | 453.7 | 474.7 | 485.1 | 506.1 | 516.5 | 537.5 | 547.9 |
| Camarilla | 487.0 | 489.8 | 492.7 | 495.6 | 498.5 | 501.4 | 504.2 |
| Woodie | 448.5 | 472.1 | 479.9 | 503.5 | 511.3 | 534.9 | 542.7 |
| Fibonacci | 474.7 | 486.7 | 494.1 | 506.1 | 518.1 | 525.5 | 537.5 |
| Pivot points | S3 | S2 | S1 | PP | R1 | R2 | R3 |
|---|---|---|---|---|---|---|---|
| Standard | 481.2 | 490.8 | 505.2 | 514.8 | 529.2 | 538.8 | 553.2 |
| Camarilla | 512.9 | 515.1 | 517.3 | 519.5 | 521.7 | 523.9 | 526.1 |
| Woodie | 483.5 | 492.0 | 507.5 | 516.0 | 531.5 | 540.0 | 555.5 |
| Fibonacci | 490.8 | 500.0 | 505.7 | 514.8 | 524.0 | 529.7 | 538.8 |
| Pivot points | S3 | S2 | S1 | PP | R1 | R2 | R3 |
|---|---|---|---|---|---|---|---|
| Standard | 455.7 | 475.4 | 506.0 | 525.7 | 556.3 | 576.0 | 606.6 |
| Camarilla | 522.7 | 527.3 | 531.9 | 536.5 | 541.1 | 545.7 | 550.3 |
| Woodie | 461.1 | 478.1 | 511.4 | 528.4 | 561.7 | 578.7 | 612.0 |
| Fibonacci | 475.4 | 494.7 | 506.5 | 525.7 | 545.0 | 556.8 | 576.0 |
Numerical data
The following is the status of the technical indicators and moving averages at the time of publication of this technical analysis:
| RSI (14): | 38.70 | |
| MACD (12,26,9): | -2.0000 | |
| Directional Movement: | -14.0 | |
| AROON (14): | -78.6 | |
| DEMA (21): | 515.6 | |
| Parabolic SAR (0,02-0,02-0,2): | 532.6 | |
| Elder Ray (13): | -17.5 | |
| Super Trend (3,10): | 531.7 | |
| Zig ZAG (10): | 496.2 | |
| VORTEX (21): | 0.9000 | |
| Stochastique (14,3,5): | 15.50 | |
| TEMA (21): | 507.0 | |
| Williams %R (14): | -95.70 | |
| Chande Momentum Oscillator (20): | -36.8 | |
| Repulse (5,40,3): | -5.6000 | |
| ROCnROLL: | 2 | |
| TRIX (15,9): | 0.1000 | |
| Courbe Coppock: | 6.40 |
| MA7: | 507.4 | |
| MA20: | 521.1 | |
| MA50: | 509.6 | |
| MA100: | 483.3 | |
| MAexp7: | 508.4 | |
| MAexp20: | 515.7 | |
| MAexp50: | 506.8 | |
| MAexp100: | 483.3 | |
| Price / MA7: | -2.29% | |
| Price / MA20: | -4.86% | |
| Price / MA50: | -2.71% | |
| Price / MA100: | +2.59% | |
| Price / MAexp7: | -2.48% | |
| Price / MAexp20: | -3.86% | |
| Price / MAexp50: | -2.17% | |
| Price / MAexp100: | +2.59% |
News
Don"t forget to follow the news on ASHMORE GRP. ORD 0.01P. At the time of publication of this analysis, the latest news was as follows:
- Ashmore Global Opportunities Ltd - Notice of AGM
- Ashmore Global Opportunities Ltd - Cancellation of the May 2019 Share Conversion
- Ashmore Global Opportunities Ltd - Notice of Compulsory Partial Redemption of Shares
- Ashmore Global Opportunities Ltd - Revaluation of an Asset
- Ashmore Global Opportunities Ltd - Annual Financial Report
About author

Online


Add a comment
Comments
0 comments on the analysis ASHMORE GRP. ORD 0.01P - Daily