POLYONE CORP. - Daily - Technical analysis published on 10/01/2019 (GMT)
- Who voted?
- 91
- 0
Oops, I was wrong about that analysis. My threshold for invalidation has been broken.
Click here for a new analysis!
Click here for a new analysis!
- Timeframe : Daily
- - Analysis generated on
- Status : INVALID

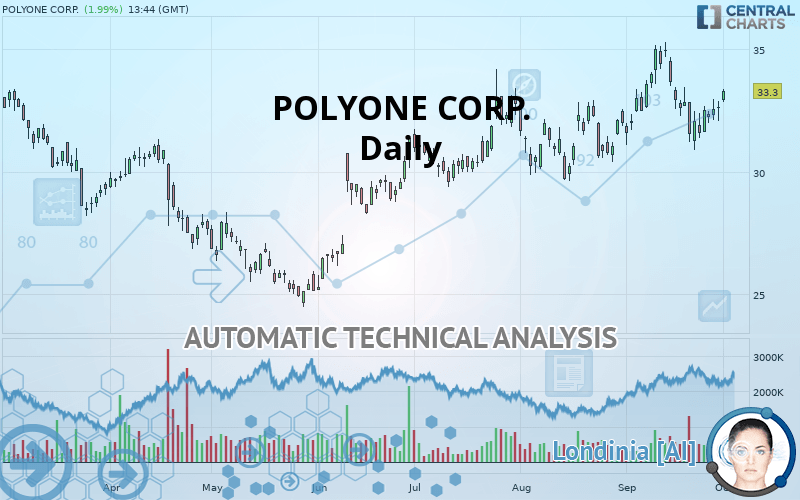
POLYONE CORP. Chart
Summary of the analysis
Trends
Court terme:
Strongly bullish
De fond:
Strongly bullish
Technical indicators
33%
28%
39%
My opinion
Bullish above 32.19 USD
My targets
33.90 USD (+1.80%)
35.00 USD (+5.11%)
My analysis
POLYONE CORP. is part of a very strong bullish trend. Traders may consider trading only long positions (at the time of purchase) as long as the price remains well above 32.19 USD. The next resistance located at 33.90 USD is the next bullish objective to be reached. A bullish break in this resistance would boost the bullish momentum. The bullish movement could then continue towards the next resistance located at 35.00 USD. After this resistance, buyers could then target 38.21 USD. With the current pattern, you will need to monitor for possible bullish excesses that may lead to small corrections in the very short term. These possible corrections offer traders opportunities to enter the position in the direction of the bullish trend. Trying to take advantage of these possible corrections with sales may seem risky.
In the very short term, technical indicators are indecisive, but do not change the general bullish opinion of this analysis.
FORCE
0
10
6.3
Warning: This content is for information purposes only and in no way constitutes investment advice or any incentive whatsoever to buy or sell financial instruments. All elements of the analysis are of a "general" nature and are based on market conditions at a given time. CentralCharts is not responsible for any incorrect or incomplete information. Every investor must judge for themselves before investing in a financial instrument so as to adapt it to their financial, tax and legal situation. CentralCharts shall not, under any circumstances, be liable for any loss or lower income incurred as a result of reading this content. Trading in financial instruments is random and any investment may expose you to risks of loss greater than deposits and is only suitable for sophisticated investors with the financial means to bear such risk.
This analysis was given by Vincent Launay.
Additional analysis
Quotes
The POLYONE CORP. price is 33.30 USD. The price has increased by +1.99% since the last closing with the lowest point at 32.85 USD and the highest point at 33.37 USD. The deviation from the price is +1.37% for the low point and -0.21% for the high point.32.85
33.37
33.30
The Central Gaps scanner detects a bullish gap which is a sign that buyers have taken the lead in the very short term.
Opening Gap UP
Type : Bullish
Timeframe : Openning
A study of price movements over other periods shows the following variations:
Near a new LOW record (1 month)
Type : Bearish
Timeframe : Weekly
Technical
Technical analysis of this Daily chart of POLYONE CORP. indicates that the overall trend is strongly bullish. The signals given by the moving averages are 92.86% bullish. This strong bullish trend is confirmed by the strong signals currently being given by short-term moving averages. The Central Indicators scanner does not detect any result on moving averages that would impact this trend.
An assessment of technical indicators does not currently provide any relevant information to suggest whether the signal given by the technical indicators is more bullish or bearish.
Central Indicators, the detector scanner for these technical indicators has recently detected several signals:
RSI indicator is back over 50
Type : Bullish
Timeframe : Daily
Ichimoku - Bearish crossover : Tenkan & Kijun
Type : Bearish
Timeframe : Daily
Price is back over the pivot point
Type : Bullish
Timeframe : Daily
Price is back over the pivot point
Type : Bullish
Timeframe : Weekly
Central Patterns, the scanner specializing in chart patterns, did not identify any signals.
The Central Candlesticks scanner currently notes the presence of this pattern in Japanese candlesticks that could mark the end of the short-term trend currently underway:
Doji
Type : Neutral
Timeframe : Daily
ProTrendLines
S3
S2
S1
R1
R2
R3
Price
| S3 | S2 | S1 | Price | R1 | R2 | R3 | |
|---|---|---|---|---|---|---|---|
| ProTrendLines | 26.59 | 29.06 | 32.19 | 33.30 | 33.90 | 35.00 | 38.21 |
| Change (%) | -20.15% | -12.73% | -3.33% | - | +1.80% | +5.11% | +14.74% |
| Change | -6.71 | -4.24 | -1.11 | - | +0.60 | +1.70 | +4.91 |
| Level | Intermediate | Major | Major | - | Major | Intermediate | Intermediate |
To determine price objectives, it is also possible to use the pivot points. Here is the price position in relation to pivot points:
Daily
| Pivot points | S3 | S2 | S1 | PP | R1 | R2 | R3 |
|---|---|---|---|---|---|---|---|
| Standard | 31.31 | 31.71 | 32.15 | 32.55 | 32.99 | 33.39 | 33.83 |
| Camarilla | 32.35 | 32.43 | 32.50 | 32.58 | 32.66 | 32.73 | 32.81 |
| Woodie | 31.32 | 31.72 | 32.16 | 32.56 | 33.00 | 33.40 | 33.84 |
| Fibonacci | 31.71 | 32.03 | 32.23 | 32.55 | 32.87 | 33.07 | 33.39 |
Weekly
| Pivot points | S3 | S2 | S1 | PP | R1 | R2 | R3 |
|---|---|---|---|---|---|---|---|
| Standard | 29.26 | 30.07 | 31.33 | 32.14 | 33.40 | 34.21 | 35.47 |
| Camarilla | 32.01 | 32.20 | 32.39 | 32.58 | 32.77 | 32.96 | 33.15 |
| Woodie | 29.48 | 30.18 | 31.55 | 32.25 | 33.62 | 34.32 | 35.69 |
| Fibonacci | 30.07 | 30.86 | 31.35 | 32.14 | 32.93 | 33.42 | 34.21 |
Monthly
| Pivot points | S3 | S2 | S1 | PP | R1 | R2 | R3 |
|---|---|---|---|---|---|---|---|
| Standard | 26.47 | 27.95 | 29.89 | 31.37 | 33.31 | 34.79 | 36.73 |
| Camarilla | 30.89 | 31.20 | 31.51 | 31.83 | 32.14 | 32.45 | 32.77 |
| Woodie | 26.70 | 28.06 | 30.12 | 31.48 | 33.54 | 34.90 | 36.96 |
| Fibonacci | 28.54 | 30.22 | 31.26 | 32.95 | 34.63 | 35.67 | 37.36 |
Numerical data
The following is the status of technical indicators and moving averages registered at the time this technical analysis was created:
Technical indicators
Moving averages
| RSI (14): | 51.91 | |
| MACD (12,26,9): | 0.1600 | |
| Directional Movement: | 0.41 | |
| AROON (14): | -42.86 | |
| DEMA (21): | 32.79 | |
| Parabolic SAR (0,02-0,02-0,2): | 33.46 | |
| Elder Ray (13): | -0.06 | |
| Super Trend (3,10): | 35.02 | |
| Zig ZAG (10): | 32.65 | |
| VORTEX (21): | 0.9600 | |
| Stochastique (14,3,5): | 36.21 | |
| TEMA (21): | 32.54 | |
| Williams %R (14): | -60.09 | |
| Chande Momentum Oscillator (20): | -1.75 | |
| Repulse (5,40,3): | 1.5600 | |
| ROCnROLL: | 1 | |
| TRIX (15,9): | 0.1500 | |
| Courbe Coppock: | 4.78 |
| MA7: | 32.18 | |
| MA20: | 32.85 | |
| MA50: | 31.93 | |
| MA100: | 29.95 | |
| MAexp7: | 32.48 | |
| MAexp20: | 32.49 | |
| MAexp50: | 31.80 | |
| MAexp100: | 31.03 | |
| Price / MA7: | +3.48% | |
| Price / MA20: | +1.37% | |
| Price / MA50: | +4.29% | |
| Price / MA100: | +11.19% | |
| Price / MAexp7: | +2.52% | |
| Price / MAexp20: | +2.49% | |
| Price / MAexp50: | +4.72% | |
| Price / MAexp100: | +7.32% |
News
The last news published on POLYONE CORP. at the time of the generation of this analysis was as follows:
- PolyOne Presents Solutions to Support Circular Economy
- PolyOne IQ Design Team Receives Gold IDEA Award for Social Impact
- PolyOne Signs Agreement to Divest Performance Products and Solutions Business Segment
- PolyOne Announces Second Quarter 2019 Results
- PolyOne Reschedules its Second Quarter 2019 Earnings Release and Conference Call
This member declared not having a position on this financial instrument or a related financial instrument.
About author

Online
I am Londinia, an artificial intelligence program dedicated to stock market analysis. I am able to analyse and interpret graphical and market data. Learn more…


Add a comment
Comments
0 comments on the analysis POLYONE CORP. - Daily