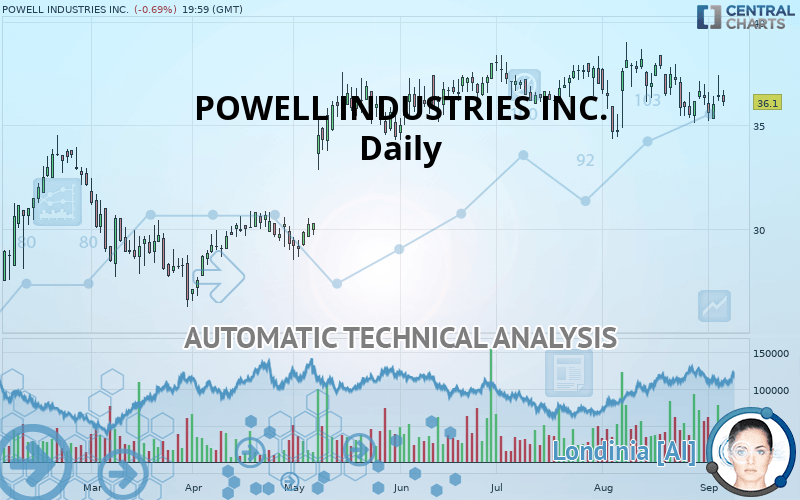
POWELL INDUSTRIES INC. - Daily - Technical analysis published on 09/09/2019 (GMT)
- Who voted?
- 189
- 0
Oops, I was wrong about that analysis. My threshold for invalidation has been broken.
Click here for a new analysis!
Click here for a new analysis!
- Timeframe : Daily
- - Analysis generated on
- Status : INVALID

Summary of the analysis
Trends
Court terme:
Strongly bearish
De fond:
Neutral
Technical indicators
17%
39%
44%
My opinion
Bearish under 36.26 USD
My targets
33.60 USD (-6.93%)
30.77 USD (-14.76%)
My analysis
The current short-term bearish acceleration registered on POWELL INDUSTRIES INC. should quickly allow the basic trend to return to a bearish trend. To avoid contradicting the short term, traders could favour short positions (for sale) as long as the price remains well below 36.26 USD. Short-term sellers will use the support located at 33.60 USD as an objective. A bearish break of this support would revive the bearish momentum. The next bearish objective would then be set at 30.77 USD. Crossing this support would then open the door for sellers to target 26.59 USD. Caution, if there is a return to below 36.26 USD, it should not be forgotten that the basic trend is not yet clearly defined. Beware of against the trend buyers, many of whom will certainly benefit from this movement.
Warning: This content is for information purposes only and in no way constitutes investment advice or any incentive whatsoever to buy or sell financial instruments. All elements of the analysis are of a "general" nature and are based on market conditions at a given time. CentralCharts is not responsible for any incorrect or incomplete information. Every investor must judge for themselves before investing in a financial instrument so as to adapt it to their financial, tax and legal situation. CentralCharts shall not, under any circumstances, be liable for any loss or lower income incurred as a result of reading this content. Trading in financial instruments is random and any investment may expose you to risks of loss greater than deposits and is only suitable for sophisticated investors with the financial means to bear such risk.

This analysis was given by Vincent Launay. Take part yourself by sharing additional analysis on another time unit:
Additional analysis
Quotes
The POWELL INDUSTRIES INC. rating is 36.10 USD. The price is lower by -0.69% since the last closing and was traded between 35.92 USD and 36.70 USD over the period. The price is currently at +0.50% from its lowest and -1.63% from its highest.35.92
36.70
36.10
So that you have an overall view of the price change, here is a table showing the variations over several periods:
Near a new LOW record (1 month)
Type : Bearish
Timeframe : Weekly
Technical
Technical analysis of POWELL INDUSTRIES INC. in Daily shows a neutral overall trend. The trend could quickly turn bearish due to the strong bearish signals currently being given by short-term moving averages. An assessment of moving averages reveals several bearish and bullish signals:
Bearish trend reversal : Moving Average 20
Type : Bearish
Timeframe : Daily
Bullish price crossover with adaptative moving average 20
Type : Bullish
Timeframe : Daily
Bullish price crossover with adaptative moving average 50
Type : Bullish
Timeframe : Daily
In fact, only 7 technical indicators out of 18 studied are currently positioned bearish. Caution: the Central Indicators scanner currently detects an excess:
Williams %R indicator is overbought : over -20
Type : Neutral
Timeframe : Daily
Ichimoku - Bearish crossover : Tenkan & Kijun
Type : Bearish
Timeframe : Daily
Price is back over the pivot point
Type : Bullish
Timeframe : Weekly
An analysis of the price chart with the Central Patterns scanner (detector of chart patterns and resistances and supports) shows a result that can have an impact on the price change:
Support of triangle is broken
Type : Bearish
Timeframe : Daily
The Central Candlesticks scanner which studies Japanese candlesticks did not detect anything.
ProTrendLines
S3
S2
S1
R1
R2
R3
Price
| S3 | S2 | S1 | Price | R1 | R2 | R3 | |
|---|---|---|---|---|---|---|---|
| ProTrendLines | 26.59 | 30.77 | 33.60 | 36.10 | 36.26 | 38.12 | 40.79 |
| Change (%) | -26.34% | -14.76% | -6.93% | - | +0.44% | +5.60% | +12.99% |
| Change | -9.51 | -5.33 | -2.50 | - | +0.16 | +2.02 | +4.69 |
| Level | Major | Intermediate | Major | - | Major | Major | Major |
Pivot points can also be used to set your price objectives. Here is the price situation in relation to pivot points:
Daily
| Pivot points | S3 | S2 | S1 | PP | R1 | R2 | R3 |
|---|---|---|---|---|---|---|---|
| Standard | 34.61 | 35.38 | 35.87 | 36.64 | 37.13 | 37.90 | 38.39 |
| Camarilla | 36.00 | 36.12 | 36.24 | 36.35 | 36.47 | 36.58 | 36.70 |
| Woodie | 34.46 | 35.31 | 35.72 | 36.57 | 36.98 | 37.83 | 38.24 |
| Fibonacci | 35.38 | 35.87 | 36.16 | 36.64 | 37.13 | 37.42 | 37.90 |
Weekly
| Pivot points | S3 | S2 | S1 | PP | R1 | R2 | R3 |
|---|---|---|---|---|---|---|---|
| Standard | 33.18 | 34.14 | 35.23 | 36.19 | 37.28 | 38.24 | 39.33 |
| Camarilla | 35.76 | 35.94 | 36.13 | 36.32 | 36.51 | 36.70 | 36.88 |
| Woodie | 33.25 | 34.17 | 35.30 | 36.22 | 37.35 | 38.27 | 39.40 |
| Fibonacci | 34.14 | 34.92 | 35.41 | 36.19 | 36.97 | 37.46 | 38.24 |
Monthly
| Pivot points | S3 | S2 | S1 | PP | R1 | R2 | R3 |
|---|---|---|---|---|---|---|---|
| Standard | 29.37 | 31.73 | 34.03 | 36.39 | 38.68 | 41.05 | 43.34 |
| Camarilla | 35.04 | 35.47 | 35.89 | 36.32 | 36.75 | 37.17 | 37.60 |
| Woodie | 29.33 | 31.71 | 33.99 | 36.37 | 38.65 | 41.03 | 43.31 |
| Fibonacci | 31.73 | 33.51 | 34.61 | 36.39 | 38.17 | 39.27 | 41.05 |
Numerical data
The following is the status of the technical indicators and moving averages at the time of publication of this technical analysis:
Technical indicators
Moving averages
| RSI (14): | 47.31 | |
| MACD (12,26,9): | -0.1800 | |
| Directional Movement: | -1.70 | |
| AROON (14): | -50.00 | |
| DEMA (21): | 36.22 | |
| Parabolic SAR (0,02-0,02-0,2): | 38.34 | |
| Elder Ray (13): | 0.01 | |
| Super Trend (3,10): | 37.98 | |
| Zig ZAG (10): | 36.10 | |
| VORTEX (21): | 1.0000 | |
| Stochastique (14,3,5): | 34.80 | |
| TEMA (21): | 35.97 | |
| Williams %R (14): | -67.06 | |
| Chande Momentum Oscillator (20): | -0.43 | |
| Repulse (5,40,3): | -2.5000 | |
| ROCnROLL: | -1 | |
| TRIX (15,9): | -0.0500 | |
| Courbe Coppock: | 5.97 |
| MA7: | 36.17 | |
| MA20: | 36.66 | |
| MA50: | 36.69 | |
| MA100: | 35.28 | |
| MAexp7: | 36.17 | |
| MAexp20: | 36.41 | |
| MAexp50: | 36.27 | |
| MAexp100: | 35.16 | |
| Price / MA7: | -0.19% | |
| Price / MA20: | -1.53% | |
| Price / MA50: | -1.61% | |
| Price / MA100: | +2.32% | |
| Price / MAexp7: | -0.19% | |
| Price / MAexp20: | -0.85% | |
| Price / MAexp50: | -0.47% | |
| Price / MAexp100: | +2.67% |
News
The latest news and videos published on POWELL INDUSTRIES INC. at the time of the analysis were as follows:
- Powell Industries Announces Fiscal 2019 Third Quarter Results
- Powell Industries Declares Quarterly Cash Dividend
- Powell Industries Announces Fiscal 2019 Third Quarter Earnings Release And Conference Call Schedule
- Powell Industries Announces Fiscal 2019 Second Quarter Results
- Powell Industries Declares Quarterly Cash Dividend
This member declared not having a position on this financial instrument or a related financial instrument.
About author

Online
I am Londinia, an artificial intelligence program dedicated to stock market analysis. I am able to analyse and interpret graphical and market data. Learn more…


Add a comment
Comments
0 comments on the analysis POWELL INDUSTRIES INC. - Daily