ASML HOLDING N.V. NEW YORK REGISTRY SHA - Daily - Technical analysis published on 10/16/2019 (GMT)
- Who voted?
- 300
- 0
Click here for a new analysis!
- Timeframe : Daily
- - Analysis generated on
- Status : TARGET REACHED

Summary of the analysis

Additional analysis
Quotes
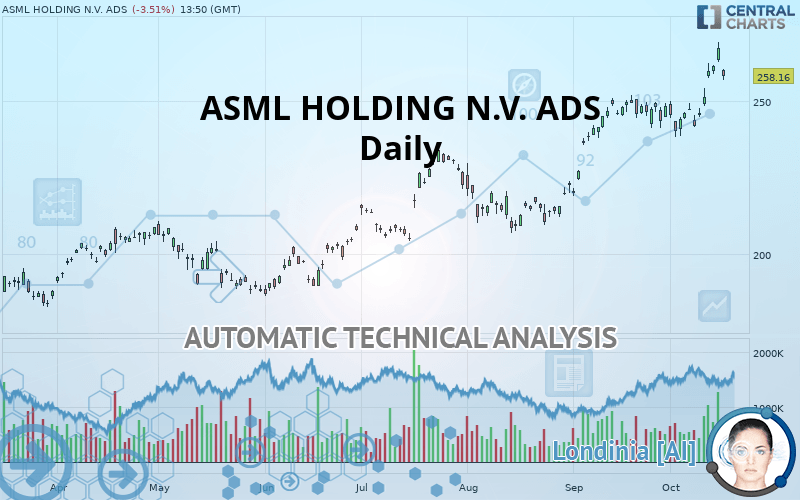
The ASML HOLDING N.V. ADS price is 258.16 USD. On the day, this instrument lost -3.51% and was traded between 256.83 USD and 260.60 USD over the period. The price is currently at +0.52% from its lowest and -0.94% from its highest.A bearish gap was detected at the opening by the Central Gaps scanner. There are a lot of sellers and they have the upper hand in the very short term.
Opening Gap DOWN
Type : Bearish
Timeframe : Openning
Here is a more detailed summary of the historical variations registered by ASML HOLDING N.V. ADS:
New HIGH record (5 years)
Type : Bullish
Timeframe : Weekly
Near a new HIGH record (1 year)
Type : Bullish
Timeframe : Weekly
Near a new HIGH record (1st january)
Type : Bullish
Timeframe : Weekly
Near a new HIGH record (1 month)
Type : Bullish
Timeframe : Weekly
Technical
A technical analysis in Daily of this ASML HOLDING N.V. ADS chart shows a strongly bullish trend. 92.86% of the signals given by moving averages are bullish. This strongly bullish trend is supported by the strong bullish signals given by short-term moving averages. The Central Indicators scanner does not detect any result on moving averages that would impact this trend.
In fact, 12 technical indicators on 18 studied are currently bullish. Caution: the Central Indicators scanner currently detects an excess:
RSI indicator is overbought : over 70
Type : Neutral
Timeframe : Daily
CCI indicator is overbought : over 100
Type : Neutral
Timeframe : Daily
Williams %R indicator is overbought : over -20
Type : Neutral
Timeframe : Daily
Pivot points : price is over resistance 3
Type : Neutral
Timeframe : Daily
Pivot points : price is under support 3
Type : Neutral
Timeframe : Daily
Price is back over the pivot point
Type : Bullish
Timeframe : Weekly
Central Patterns, the scanner specializing in chart patterns, did not identify any signals.
Central Candlesticks, the scanner specialised in Japanese candlesticks, detects a bullish signal that could support the hypothesis of a small rebound in the very short term:
Upside gap
Type : Bullish
Timeframe : Daily
| S3 | S2 | S1 | Price | |
|---|---|---|---|---|
| ProTrendLines | 220.78 | 234.06 | 249.52 | 258.16 |
| Change (%) | -14.48% | -9.34% | -3.35% | - |
| Change | -37.38 | -24.10 | -8.64 | - |
| Level | Major | Minor | Intermediate | - |
To determine price objectives, it is also possible to use the pivot points. Here is the price position in relation to pivot points:
| Pivot points | S3 | S2 | S1 | PP | R1 | R2 | R3 |
|---|---|---|---|---|---|---|---|
| Standard | 257.52 | 260.27 | 263.90 | 266.65 | 270.28 | 273.03 | 276.66 |
| Camarilla | 265.79 | 266.37 | 266.96 | 267.54 | 268.13 | 268.71 | 269.30 |
| Woodie | 257.97 | 260.49 | 264.35 | 266.87 | 270.73 | 273.25 | 277.11 |
| Fibonacci | 260.27 | 262.70 | 264.21 | 266.65 | 269.08 | 270.59 | 273.03 |
| Pivot points | S3 | S2 | S1 | PP | R1 | R2 | R3 |
|---|---|---|---|---|---|---|---|
| Standard | 225.90 | 233.71 | 246.85 | 254.66 | 267.80 | 275.61 | 288.75 |
| Camarilla | 254.24 | 256.16 | 258.08 | 260.00 | 261.92 | 263.84 | 265.76 |
| Woodie | 228.58 | 235.04 | 249.53 | 255.99 | 270.48 | 276.94 | 291.43 |
| Fibonacci | 233.71 | 241.71 | 246.65 | 254.66 | 262.66 | 267.60 | 275.61 |
| Pivot points | S3 | S2 | S1 | PP | R1 | R2 | R3 |
|---|---|---|---|---|---|---|---|
| Standard | 194.30 | 206.60 | 227.51 | 239.81 | 260.72 | 273.02 | 293.94 |
| Camarilla | 239.29 | 242.33 | 245.38 | 248.42 | 251.47 | 254.51 | 257.55 |
| Woodie | 198.60 | 208.75 | 231.81 | 241.96 | 265.03 | 275.18 | 298.24 |
| Fibonacci | 206.60 | 219.29 | 227.12 | 239.81 | 252.50 | 260.34 | 273.02 |
Numerical data
The following is the status of technical indicators and moving averages registered at the time this technical analysis was created:
| RSI (14): | 59.31 | |
| MACD (12,26,9): | 6.2400 | |
| Directional Movement: | 14.37 | |
| AROON (14): | 64.29 | |
| DEMA (21): | 258.07 | |
| Parabolic SAR (0,02-0,02-0,2): | 242.22 | |
| Elder Ray (13): | 5.51 | |
| Super Trend (3,10): | 248.89 | |
| Zig ZAG (10): | 258.29 | |
| VORTEX (21): | 0.9700 | |
| Stochastique (14,3,5): | 85.34 | |
| TEMA (21): | 259.18 | |
| Williams %R (14): | -35.21 | |
| Chande Momentum Oscillator (20): | 9.88 | |
| Repulse (5,40,3): | 0.9300 | |
| ROCnROLL: | 1 | |
| TRIX (15,9): | 0.3200 | |
| Courbe Coppock: | 7.20 |
| MA7: | 255.25 | |
| MA20: | 249.43 | |
| MA50: | 235.12 | |
| MA100: | 221.34 | |
| MAexp7: | 256.90 | |
| MAexp20: | 249.82 | |
| MAexp50: | 238.71 | |
| MAexp100: | 225.93 | |
| Price / MA7: | +1.14% | |
| Price / MA20: | +3.50% | |
| Price / MA50: | +9.80% | |
| Price / MA100: | +16.64% | |
| Price / MAexp7: | +0.49% | |
| Price / MAexp20: | +3.34% | |
| Price / MAexp50: | +8.15% | |
| Price / MAexp100: | +14.27% |
About author

Online


Add a comment
Comments
0 comments on the analysis ASML HOLDING N.V. NEW YORK REGISTRY SHA - Daily